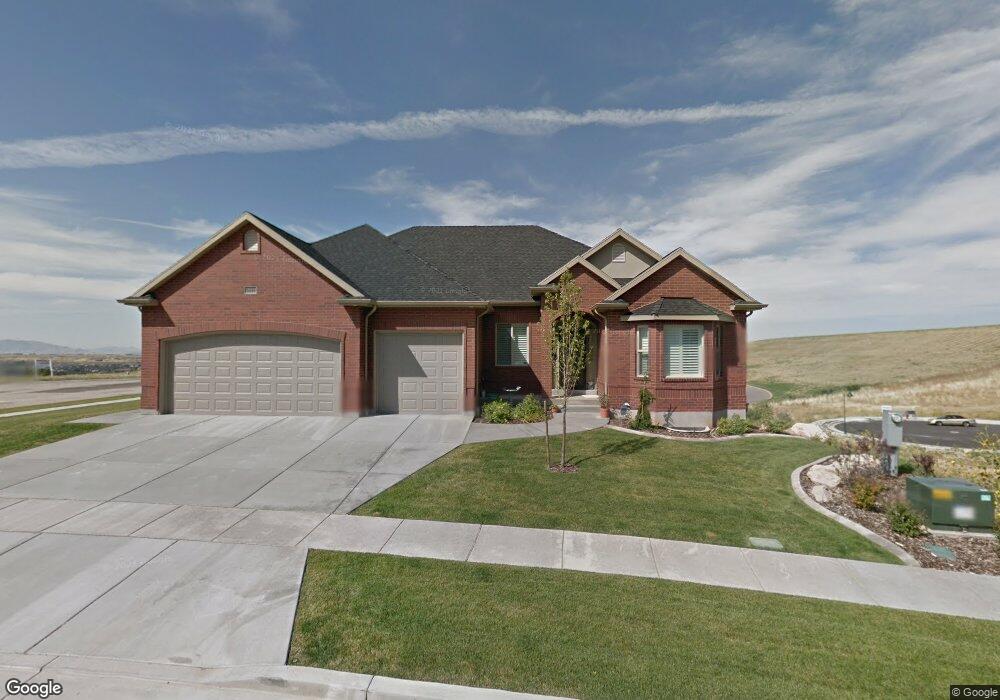
5559 Cherrywood Way Ogden, UT 84403
Southeast Ogden NeighborhoodEstimated Value: $784,000 - $848,000
4
Beds
2
Baths
2,238
Sq Ft
$364/Sq Ft
Est. Value
About This Home
This home is located at 5559 Cherrywood Way, Ogden, UT 84403 and is currently estimated at $814,359, approximately $363 per square foot. 5559 Cherrywood Way is a home with nearby schools including Shadow Valley School, Mount Ogden Junior High School, and Ogden High School.
Ownership History
Date
Name
Owned For
Owner Type
Purchase Details
Closed on
Jan 18, 2019
Sold by
Weinstock Timothy R
Bought by
Weinstock Timothy R and Weinstock Sandra D
Current Estimated Value
Purchase Details
Closed on
Jul 18, 2016
Bought by
Weinstock Timothy R
Home Financials for this Owner
Home Financials are based on the most recent Mortgage that was taken out on this home.
Original Mortgage
$222,665
Outstanding Balance
$176,831
Interest Rate
3.42%
Estimated Equity
$637,528
Purchase Details
Closed on
May 4, 2011
Sold by
The Hamptons Development & Construction
Bought by
Weinstock Timothy R and Weinstock Sandra D
Home Financials for this Owner
Home Financials are based on the most recent Mortgage that was taken out on this home.
Original Mortgage
$115,000
Interest Rate
4.77%
Mortgage Type
New Conventional
Create a Home Valuation Report for This Property
The Home Valuation Report is an in-depth analysis detailing your home's value as well as a comparison with similar homes in the area
Home Values in the Area
Average Home Value in this Area
Purchase History
| Date | Buyer | Sale Price | Title Company |
|---|---|---|---|
| Weinstock Timothy R | -- | Backman Title Services Ltd | |
| Weinstock Timothy R | -- | -- | |
| Weinstock Timothy R | -- | Mountain View Title Ogden |
Source: Public Records
Mortgage History
| Date | Status | Borrower | Loan Amount |
|---|---|---|---|
| Open | Weinstock Timothy R | $222,665 | |
| Closed | Weinstock Timothy R | -- | |
| Previous Owner | Weinstock Timothy R | $115,000 |
Source: Public Records
Tax History Compared to Growth
Tax History
| Year | Tax Paid | Tax Assessment Tax Assessment Total Assessment is a certain percentage of the fair market value that is determined by local assessors to be the total taxable value of land and additions on the property. | Land | Improvement |
|---|---|---|---|---|
| 2025 | $5,397 | $795,971 | $234,983 | $560,988 |
| 2024 | $5,397 | $427,349 | $129,240 | $298,109 |
| 2023 | $5,604 | $446,600 | $129,204 | $317,396 |
| 2022 | $6,204 | $480,700 | $110,006 | $370,694 |
| 2021 | $5,509 | $707,000 | $120,069 | $586,931 |
| 2020 | $5,564 | $661,000 | $119,981 | $541,019 |
| 2019 | $5,279 | $590,000 | $119,981 | $470,019 |
| 2018 | $5,292 | $589,000 | $99,245 | $489,755 |
| 2017 | $4,972 | $521,000 | $110,000 | $411,000 |
| 2016 | $4,384 | $248,954 | $60,500 | $188,454 |
| 2015 | $4,574 | $254,484 | $60,500 | $193,984 |
| 2014 | $4,276 | $234,250 | $44,000 | $190,250 |
Source: Public Records
Map
Nearby Homes
- 2342 E Combe Rd
- 5670 Redwood Ln
- 1900 E 5625 S
- 1955 Eastwood Blvd
- 5600 Meadow Ln Unit 193
- 1829 Choctaw Ridge
- 1896 E 5725 S
- 5660 S Meadow Ln Unit 156
- 1880 Shadow Valley Dr
- 1872 E 5725 S
- 5304 S Skyline Pkwy
- 5676 Meadow Ln Unit 123
- 1811 Shadow Valley Dr
- 1854 E 5750 S
- 5822 S 1900 St E
- 2012 E 5875 S
- 1710 Mohawk Ln
- 5883 Jared Way
- 1792 E 5625 S Unit C
- 6388 Suzanne St S Unit 123
- 1940 Hampton Green Way
- 1915 Hampton Ridge
- 1915 Hampton Ridge
- 1915 Hampton Ridge Unit 37
- 1921 Hampton Ridge
- 1921 Hampton Ridge Unit 36
- 1921 Hampton Ridge Unit 36
- 1921 Hampton Ridge
- 1927 Hampton Green Way Unit 73
- 1927 Hampton Green Way
- 1935 Hampton Green Way
- 1935 Hampton Green Way Unit 74
- 5550 Cherrywood Way
- 1937 Hampton Ridge
- 1955 Hampton Ridge
- 1943 Hampton Green Way Unit 66
- 1943 Hampton Green Way
- 5542 Cherrywood Way
- 5542 Cherrywood Way
- 1932 Hampton Green Way