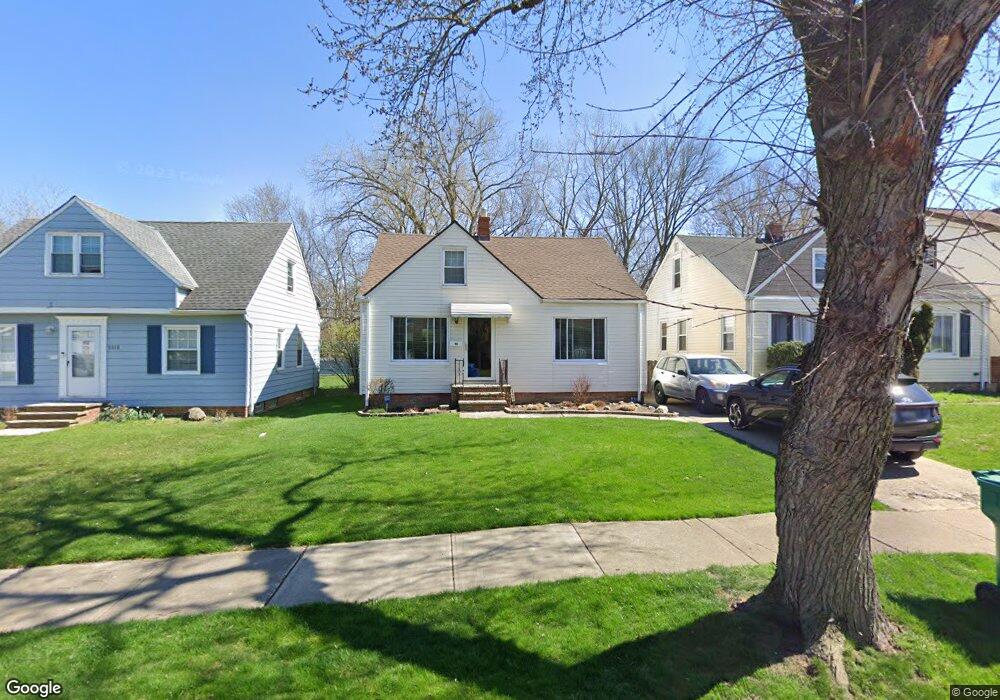
5559 Dalewood Ave Maple Heights, OH 44137
Estimated Value: $101,019 - $169,000
2
Beds
1
Bath
900
Sq Ft
$136/Sq Ft
Est. Value
About This Home
This home is located at 5559 Dalewood Ave, Maple Heights, OH 44137 and is currently estimated at $122,505, approximately $136 per square foot. 5559 Dalewood Ave is a home located in Cuyahoga County with nearby schools including Abraham Lincoln Elementary School, Rockside/ J.F. Kennedy School, and Barack Obama School.
Ownership History
Date
Name
Owned For
Owner Type
Purchase Details
Closed on
Mar 3, 2001
Sold by
Kovacic Craig W
Bought by
Murico Kovacic Marcia A
Current Estimated Value
Purchase Details
Closed on
Dec 22, 2000
Sold by
Murico Kovacic Marcia A
Bought by
Murico Kovacic Marcia A and Kovacic Craig W
Purchase Details
Closed on
Oct 15, 1999
Sold by
Murico Marcia and Lanovara Marcia
Bought by
Murico Lisinda R
Purchase Details
Closed on
Oct 12, 1998
Sold by
Lanovara Joseph I
Bought by
Lanovara Marcia
Purchase Details
Closed on
Nov 17, 1989
Sold by
Perko Jerry G
Bought by
Lanovara Joseph I
Purchase Details
Closed on
Sep 10, 1982
Sold by
Szczech Harriet
Bought by
Perko Jerry G
Purchase Details
Closed on
Dec 12, 1980
Sold by
Racki Helen
Bought by
Szczech Harriet
Purchase Details
Closed on
Jan 1, 1975
Bought by
Racki Helen
Create a Home Valuation Report for This Property
The Home Valuation Report is an in-depth analysis detailing your home's value as well as a comparison with similar homes in the area
Home Values in the Area
Average Home Value in this Area
Purchase History
| Date | Buyer | Sale Price | Title Company |
|---|---|---|---|
| Murico Kovacic Marcia A | -- | -- | |
| Murico Kovacic Marcia A | -- | -- | |
| Murico Kovacic Marcia A | -- | -- | |
| Murico Lisinda R | -- | -- | |
| Lanovara Marcia | -- | -- | |
| Lanovara Joseph I | $48,000 | -- | |
| Perko Jerry G | $33,500 | -- | |
| Szczech Harriet | -- | -- | |
| Racki Helen | -- | -- |
Source: Public Records
Tax History
| Year | Tax Paid | Tax Assessment Tax Assessment Total Assessment is a certain percentage of the fair market value that is determined by local assessors to be the total taxable value of land and additions on the property. | Land | Improvement |
|---|---|---|---|---|
| 2024 | $1,844 | $29,645 | $6,650 | $22,995 |
| 2023 | $1,561 | $23,660 | $4,760 | $18,900 |
| 2022 | $1,593 | $23,660 | $4,760 | $18,900 |
| 2021 | $1,698 | $23,660 | $4,760 | $18,900 |
| 2020 | $1,227 | $17,920 | $3,610 | $14,320 |
| 2019 | $1,216 | $51,200 | $10,300 | $40,900 |
| 2018 | $1,208 | $17,920 | $3,610 | $14,320 |
| 2017 | $1,091 | $16,660 | $4,690 | $11,970 |
| 2016 | $1,052 | $16,660 | $4,690 | $11,970 |
| 2015 | $2,086 | $16,660 | $4,690 | $11,970 |
| 2014 | $2,086 | $18,310 | $5,150 | $13,160 |
Source: Public Records
Map
Nearby Homes
- 5550 Grasmere Ave
- 5666 Waterbury Ave
- 5481 Dalewood Ave
- 16672 Broadway Ave
- 5493 Thomas St
- 17005 Mapleboro Ave
- 17409 Mapleboro Ave
- 5650 Lafayette Ave
- 5716 South Blvd
- 5728 South Blvd
- 5736 South Blvd
- 16907 Maple Heights Blvd
- 5713 South Blvd
- 157 Flora Dr
- 158 Flora Dr
- 18301 Edinboro Ave
- 17916 North Blvd
- 5382 Lee Rd Unit 102
- 5382 Lee Rd Unit 204
- 5382 Lee Rd Unit 202
- 5563 Dalewood Ave
- 5555 Dalewood Ave
- 5567 Dalewood Ave
- 5571 Dalewood Ave
- 5547 Dalewood Ave
- 5575 Dalewood Ave
- 5558 Dalewood Ave
- 5562 Dalewood Ave
- 5554 Dalewood Ave
- 5566 Dalewood Ave
- 5541 Dalewood Ave
- 5579 Dalewood Ave
- 5546 Dalewood Ave
- 5537 Dalewood Ave
- 5574 Dalewood Ave
- 5583 Dalewood Ave
- 5578 Dalewood Ave
- 5533 Dalewood Ave
- 5536 Dalewood Ave
- 5541 Grasmere Ave
Your Personal Tour Guide
Ask me questions while you tour the home.