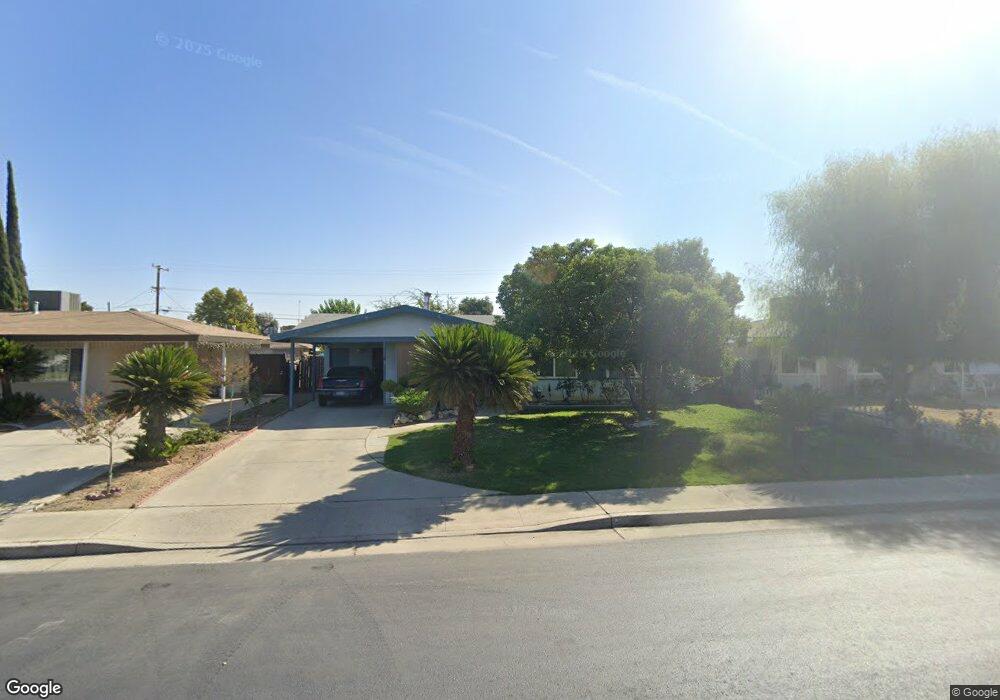
556 7th St Mc Farland, CA 93250
Estimated Value: $278,000 - $336,000
4
Beds
2
Baths
1,361
Sq Ft
$224/Sq Ft
Est. Value
About This Home
This home is located at 556 7th St, Mc Farland, CA 93250 and is currently estimated at $305,468, approximately $224 per square foot. 556 7th St is a home located in Kern County with nearby schools including McFarland High School.
Ownership History
Date
Name
Owned For
Owner Type
Purchase Details
Closed on
May 11, 2023
Sold by
Myrick Edward L
Bought by
Myrick Edward L and Reed Elizabeth
Current Estimated Value
Purchase Details
Closed on
Nov 2, 2001
Sold by
Myrick Ruth E
Bought by
Myrick Ruth E and Myrick Edward L
Home Financials for this Owner
Home Financials are based on the most recent Mortgage that was taken out on this home.
Original Mortgage
$72,000
Interest Rate
6.57%
Purchase Details
Closed on
Oct 10, 1995
Sold by
Myrick William T and Myrick Ruth E
Bought by
Myrick William T and Myrick Ruth E
Create a Home Valuation Report for This Property
The Home Valuation Report is an in-depth analysis detailing your home's value as well as a comparison with similar homes in the area
Home Values in the Area
Average Home Value in this Area
Purchase History
| Date | Buyer | Sale Price | Title Company |
|---|---|---|---|
| Myrick Edward L | -- | None Listed On Document | |
| Myrick Ruth E | $29,500 | -- | |
| Myrick Ruth E | -- | -- | |
| Myrick William T | -- | -- |
Source: Public Records
Mortgage History
| Date | Status | Borrower | Loan Amount |
|---|---|---|---|
| Previous Owner | Myrick Ruth E | $72,000 |
Source: Public Records
Tax History
| Year | Tax Paid | Tax Assessment Tax Assessment Total Assessment is a certain percentage of the fair market value that is determined by local assessors to be the total taxable value of land and additions on the property. | Land | Improvement |
|---|---|---|---|---|
| 2025 | $699 | $45,591 | $7,652 | $37,939 |
| 2024 | $684 | $44,698 | $7,502 | $37,196 |
| 2023 | $684 | $43,822 | $7,355 | $36,467 |
| 2022 | $663 | $42,963 | $7,211 | $35,752 |
| 2021 | $602 | $42,121 | $7,070 | $35,051 |
| 2020 | $570 | $41,690 | $6,998 | $34,692 |
| 2019 | $463 | $41,690 | $6,998 | $34,692 |
| 2018 | $456 | $40,073 | $6,727 | $33,346 |
| 2017 | $445 | $39,289 | $6,596 | $32,693 |
| 2016 | $438 | $38,519 | $6,467 | $32,052 |
| 2015 | $430 | $37,941 | $6,370 | $31,571 |
| 2014 | $428 | $37,199 | $6,246 | $30,953 |
Source: Public Records
Map
Nearby Homes
- 314 8th St
- 0 W Sherwood Ave Unit 202506495
- 405 Harlow Ave
- 830 Davis Ave
- 0 Costa Alyssa Dr Unit 202602697
- 105 E Kern Ave
- 216 Browning Rd
- 749 Browning Rd
- 737 Concord Ct
- 13271 Garzoli Ave
- 799 Moscato St
- 583 Taylor Ave
- 1085 Mast Ave
- 31737 Elmo Hwy
- 775 Mast Ave
- 12606 Stradley Ave
- 30372 Pond Rd
- 11697 Melcher Rd
- 12231 Benner St
- 294 Shell Beach Ct
Your Personal Tour Guide
Ask me questions while you tour the home.