556 Cantering Place E Unit 12556 Columbus, OH 43230
Estimated Value: $226,445 - $244,000
2
Beds
2
Baths
1,022
Sq Ft
$230/Sq Ft
Est. Value
About This Home
This home is located at 556 Cantering Place E Unit 12556, Columbus, OH 43230 and is currently estimated at $235,111, approximately $230 per square foot. 556 Cantering Place E Unit 12556 is a home located in Franklin County with nearby schools including High Point Elementary School, Gahanna East Middle School, and Lincoln High School.
Ownership History
Date
Name
Owned For
Owner Type
Purchase Details
Closed on
Oct 8, 2004
Sold by
Lin Yung I and Lin Chao C
Bought by
Gossing Penny P
Current Estimated Value
Home Financials for this Owner
Home Financials are based on the most recent Mortgage that was taken out on this home.
Original Mortgage
$105,500
Interest Rate
5.7%
Mortgage Type
Purchase Money Mortgage
Purchase Details
Closed on
Apr 6, 2001
Sold by
Epcon Investments L L C
Bought by
Naples Mary C
Home Financials for this Owner
Home Financials are based on the most recent Mortgage that was taken out on this home.
Original Mortgage
$86,300
Interest Rate
7.05%
Mortgage Type
Purchase Money Mortgage
Purchase Details
Closed on
Dec 24, 1996
Sold by
Epcon Group Inc
Bought by
Epcon Investments Llc
Home Financials for this Owner
Home Financials are based on the most recent Mortgage that was taken out on this home.
Original Mortgage
$71,900
Interest Rate
7.74%
Mortgage Type
New Conventional
Create a Home Valuation Report for This Property
The Home Valuation Report is an in-depth analysis detailing your home's value as well as a comparison with similar homes in the area
Purchase History
| Date | Buyer | Sale Price | Title Company |
|---|---|---|---|
| Gossing Penny P | $125,500 | Chicago Tit | |
| Naples Mary C | $107,900 | Chicago Title | |
| Epcon Investments Llc | $95,900 | -- |
Source: Public Records
Mortgage History
| Date | Status | Borrower | Loan Amount |
|---|---|---|---|
| Previous Owner | Gossing Penny P | $105,500 | |
| Previous Owner | Naples Mary C | $86,300 | |
| Previous Owner | Epcon Investments Llc | $71,900 |
Source: Public Records
Tax History
| Year | Tax Paid | Tax Assessment Tax Assessment Total Assessment is a certain percentage of the fair market value that is determined by local assessors to be the total taxable value of land and additions on the property. | Land | Improvement |
|---|---|---|---|---|
| 2025 | $4,111 | $69,790 | $15,750 | $54,040 |
| 2024 | $4,111 | $69,790 | $15,750 | $54,040 |
| 2023 | $4,060 | $69,790 | $15,750 | $54,040 |
| 2022 | $3,260 | $43,650 | $7,980 | $35,670 |
| 2021 | $3,153 | $43,650 | $7,980 | $35,670 |
| 2020 | $3,126 | $43,650 | $7,980 | $35,670 |
| 2019 | $2,610 | $36,370 | $6,650 | $29,720 |
| 2018 | $2,428 | $36,370 | $6,650 | $29,720 |
| 2017 | $2,329 | $36,370 | $6,650 | $29,720 |
| 2016 | $2,263 | $31,290 | $6,790 | $24,500 |
| 2015 | $2,265 | $31,290 | $6,790 | $24,500 |
| 2014 | $2,247 | $31,290 | $6,790 | $24,500 |
| 2013 | $1,240 | $34,755 | $7,525 | $27,230 |
Source: Public Records
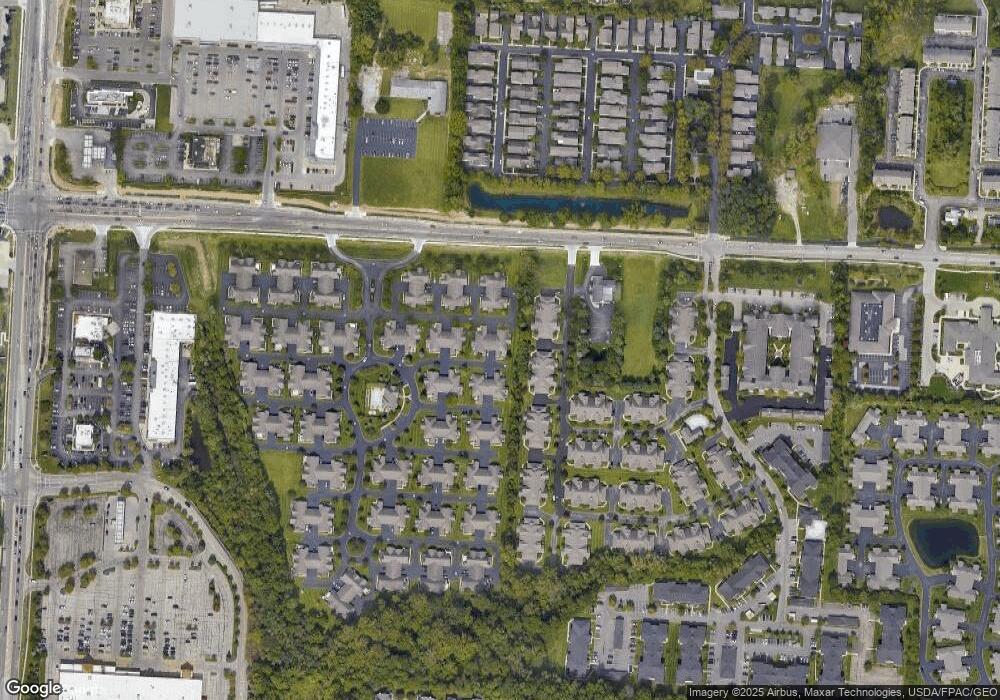
Map
Nearby Homes
- 6019 Bentgate Ln Unit 60192
- 622 Piney Glen Dr
- 3755 Renwick Ln Unit 39
- 3755 Renwick Ln
- 3753 Brightwell Ln
- 1317 Amberlea Dr W Unit 81317
- 1308 Amberlea Dr W Unit 11
- 636 Grove Cir Unit 1803
- 4574 N Hamilton Rd
- 6185 Needletail Rd Unit 64
- 1126 Sanctuary Place Unit 4
- 3826 Wood Stork Ln Unit 68
- 524 Mechwart Place Unit 524
- 6187 Joes Hopper Rd Unit 73
- 6191 Joes Hopper Rd Unit 73
- 4651 E Johnstown Rd
- 1160 Riva Ridge Blvd
- 1299 Granfield Ct
- 4648 E Johnstown Rd
- 3863 Preserve Crossing Blvd Unit 47
- 555 Dandy Brush Ln E Unit 12555
- 550 Cantering Place E Unit 12550
- 553 Dandy Brush Ln E
- 557 Cantering Place E
- 549 Cantering Place E Unit 16549
- 1387 Grey Oaks Dr Unit 1387
- 558 Saddlery Dr E
- 547 Dandy Brush Ln E Unit 11547
- 1393 Grey Oaks Dr Unit 1393
- 1383 Grey Oaks Dr Unit 1383
- 538 Cantering Place E
- 539 Cantering Place E
- 546 Saddlery Dr E Unit 16-546
- 1389 Grey Oaks Dr Unit 1389
- 562 Dandy Brush Ln E
- 562 Dandy Brush Ln E Unit 6-562
- 554 Dandy Brush Ln E Unit 6554
- 1385 Grey Oaks Dr Unit 1385
- 1395 Grey Oaks Dr Unit 1395
- 1397 Grey Oaks Dr Unit 1397
Your Personal Tour Guide
Ask me questions while you tour the home.