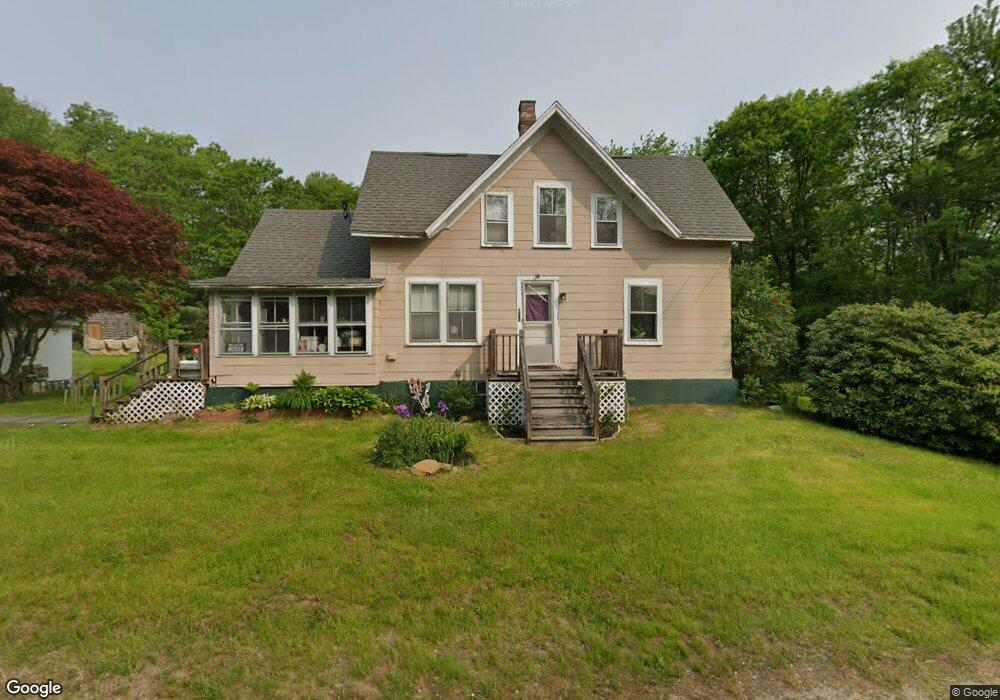
556 Cathance Rd Topsham, ME 04086
Estimated Value: $250,000 - $360,000
3
Beds
1
Bath
1,032
Sq Ft
$298/Sq Ft
Est. Value
About This Home
This home is located at 556 Cathance Rd, Topsham, ME 04086 and is currently estimated at $307,236, approximately $297 per square foot. 556 Cathance Rd is a home located in Sagadahoc County with nearby schools including Mt Ararat High School.
Ownership History
Date
Name
Owned For
Owner Type
Purchase Details
Closed on
Apr 29, 2022
Sold by
Baribeau Michael H and Baribeau Dianna S
Bought by
Barineau Moriah F and Whittaker Brendon J
Current Estimated Value
Home Financials for this Owner
Home Financials are based on the most recent Mortgage that was taken out on this home.
Original Mortgage
$153,000
Outstanding Balance
$143,332
Interest Rate
4.16%
Mortgage Type
Purchase Money Mortgage
Estimated Equity
$163,904
Purchase Details
Closed on
May 26, 2010
Sold by
Joslyn Erland C Est and Trufant
Bought by
Baribeau Michael H and Baribeau Dianna S
Home Financials for this Owner
Home Financials are based on the most recent Mortgage that was taken out on this home.
Original Mortgage
$65,564
Interest Rate
5.13%
Mortgage Type
FHA
Create a Home Valuation Report for This Property
The Home Valuation Report is an in-depth analysis detailing your home's value as well as a comparison with similar homes in the area
Home Values in the Area
Average Home Value in this Area
Purchase History
| Date | Buyer | Sale Price | Title Company |
|---|---|---|---|
| Barineau Moriah F | $170,000 | None Available | |
| Baribeau Michael H | $60,000 | -- |
Source: Public Records
Mortgage History
| Date | Status | Borrower | Loan Amount |
|---|---|---|---|
| Open | Barineau Moriah F | $153,000 | |
| Previous Owner | Baribeau Michael H | $69,500 | |
| Previous Owner | Baribeau Michael H | $65,564 |
Source: Public Records
Tax History Compared to Growth
Tax History
| Year | Tax Paid | Tax Assessment Tax Assessment Total Assessment is a certain percentage of the fair market value that is determined by local assessors to be the total taxable value of land and additions on the property. | Land | Improvement |
|---|---|---|---|---|
| 2025 | $3,174 | $248,000 | $64,800 | $183,200 |
| 2024 | $3,081 | $246,500 | $60,000 | $186,500 |
| 2023 | $2,982 | $219,600 | $57,300 | $162,300 |
| 2022 | $2,636 | $182,800 | $55,200 | $127,600 |
| 2021 | $2,561 | $161,400 | $50,700 | $110,700 |
| 2020 | $2,627 | $147,100 | $50,700 | $96,400 |
| 2019 | $2,576 | $134,500 | $50,700 | $83,800 |
| 2018 | $2,339 | $124,900 | $45,300 | $79,600 |
| 2017 | $2,263 | $124,900 | $45,300 | $79,600 |
| 2016 | $2,216 | $123,200 | $45,300 | $77,900 |
| 2015 | $2,152 | $119,800 | $45,300 | $74,500 |
| 2014 | $2,019 | $116,500 | $45,300 | $71,200 |
| 2013 | $1,940 | $116,500 | $45,300 | $71,200 |
Source: Public Records
Map
Nearby Homes
- 428 Cathance Rd
- 75 Adams Landing Rd
- 594 Middlesex Rd
- 51 Mountain View Cir
- Lot 08 Sara's Way
- 210 Augusta Rd
- 314 Meadow Rd
- 156 Main St
- 27 Tegans Way
- 17 Chestnut Dr
- 45A-A Hornbeck Cross
- 26 Bay Park Dr
- 55 Munroe Ln
- 215 Ward Rd
- 34 Compass Ln
- 55 Somerset Place
- 2 Haskell Cir
- 14 Loon Dr
- 1 Birch Ridge Ave
- 35 Eider Ln
- 548 Cathance Rd
- 564 Cathance Rd
- 538 Cathance Rd
- 19 Trufant Ln
- 557 Cathance Rd
- 569 Cathance Rd
- 23 Feldspar Cir
- 25 Feldspar Cir
- 15 Feldspar Cir
- 31 Feldspar Cir
- 525 Cathance Rd
- 588 Cathance Rd
- 19 E Schoolhouse Crossing Rd
- 19 E School House Crossing Rd
- 549 Cathance Rd
- 1 Feldspar Cir
- 524 Cathance Rd
- 10 Feldspar Cir
- 24 Feldspar Cir
- 6 Feldspar Cir