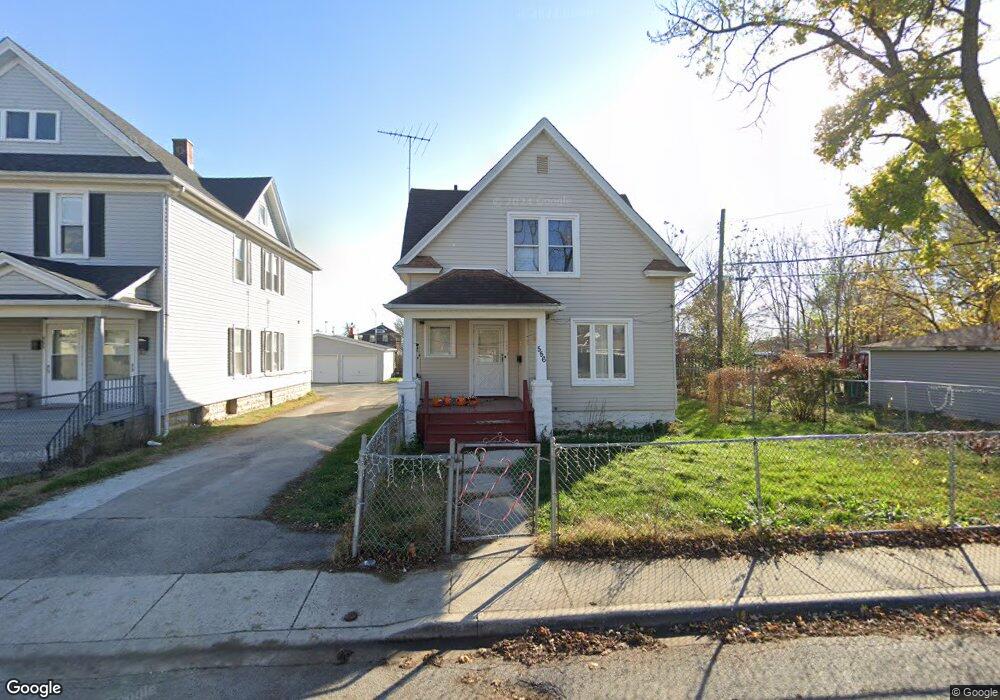
556 Dover St Joliet, IL 60432
Northeast Joliet NeighborhoodEstimated Value: $185,438 - $208,000
3
Beds
1
Bath
1,239
Sq Ft
$158/Sq Ft
Est. Value
About This Home
This home is located at 556 Dover St, Joliet, IL 60432 and is currently estimated at $196,110, approximately $158 per square foot. 556 Dover St is a home located in Will County with nearby schools including Woodland Elementary School, Washington Jr. High School and Academy, and Joliet Central High School.
Ownership History
Date
Name
Owned For
Owner Type
Purchase Details
Closed on
Aug 26, 2016
Sold by
Short Sale Gal Inc
Bought by
Morales Barragan Jose De Jesus and Sosa Cortez Nereyda Sujey
Current Estimated Value
Purchase Details
Closed on
Jul 1, 2005
Sold by
Wright Jimmie L and Wright Ruthie L
Bought by
Roberson Gerald
Home Financials for this Owner
Home Financials are based on the most recent Mortgage that was taken out on this home.
Original Mortgage
$83,000
Interest Rate
5.99%
Mortgage Type
Stand Alone First
Purchase Details
Closed on
Sep 4, 2003
Sold by
Us Bank Na
Bought by
Wright Ruthie L and Wright Jimmie L
Purchase Details
Closed on
Jun 27, 2003
Sold by
Raines Gerald W and Case #02 Ch 1422
Bought by
U S Bank Na and Eqcc Home Equity Loan Trust 1999-1
Purchase Details
Closed on
Apr 30, 2003
Sold by
Raines Gerald W and City Of Joliet
Bought by
U S Bank Na and First Bank Na Trust
Create a Home Valuation Report for This Property
The Home Valuation Report is an in-depth analysis detailing your home's value as well as a comparison with similar homes in the area
Home Values in the Area
Average Home Value in this Area
Purchase History
We collect this data history from publicly available records. To have your information removed, we recommend requesting removal directly through your county’s website.
| Date | Buyer | Sale Price | Title Company |
|---|---|---|---|
| Morales Barragan Jose De Jesus | $39,000 | Fidelity National Title | |
| Short Sale Gal Inc | $39,000 | Fidelity National Title | |
| Roberson Gerald | $108,000 | Multiple | |
| Wright Ruthie L | $45,000 | Multiple | |
| U S Bank Na | -- | -- | |
| U S Bank Na | $52,753 | -- |
Source: Public Records
Mortgage History
We collect this data history from publicly available records. To have your information removed, we recommend requesting removal directly through your county’s website.
| Date | Status | Borrower | Loan Amount |
|---|---|---|---|
| Previous Owner | Roberson Gerald | $83,000 |
Source: Public Records
Tax History
| Year | Tax Paid | Tax Assessment Tax Assessment Total Assessment is a certain percentage of the fair market value that is determined by local assessors to be the total taxable value of land and additions on the property. | Land | Improvement |
|---|---|---|---|---|
| 2024 | $3,871 | $44,102 | $10,535 | $33,567 |
| 2023 | $3,694 | $39,184 | $9,360 | $29,824 |
| 2022 | $3,273 | $35,445 | $8,467 | $26,978 |
| 2021 | $3,111 | $33,105 | $7,908 | $25,197 |
| 2020 | $2,952 | $31,439 | $7,510 | $23,929 |
| 2019 | $2,808 | $29,219 | $6,980 | $22,239 |
| 2018 | $2,612 | $26,218 | $6,277 | $19,941 |
| 2017 | $2,462 | $23,837 | $5,707 | $18,130 |
| 2016 | $1,705 | $21,863 | $5,226 | $16,637 |
| 2015 | $1,678 | $20,500 | $4,900 | $15,600 |
| 2014 | $1,678 | $20,400 | $4,900 | $15,500 |
| 2013 | $1,678 | $22,106 | $5,453 | $16,653 |
Source: Public Records
Map
Nearby Homes
- 569 E Cass St
- 205 Casseday Ave
- 557 E Jackson St
- 251 E Jackson St
- 600 E Washington St
- 456 Collins St
- 15 Iowa Ave
- 21 Wilson Ave
- 209 Ohio St
- 204 Iowa Ave
- 650 Ward Ave
- 105 S Eastern Ave
- 999 W Cass St
- 315 Richards St
- 456 Florence Ave
- 111 Court St
- 621 Elmwood Ave
- 404 Sherman St
- 106 S Joliet St
- 155 S Ottawa St
Your Personal Tour Guide
Ask me questions while you tour the home.