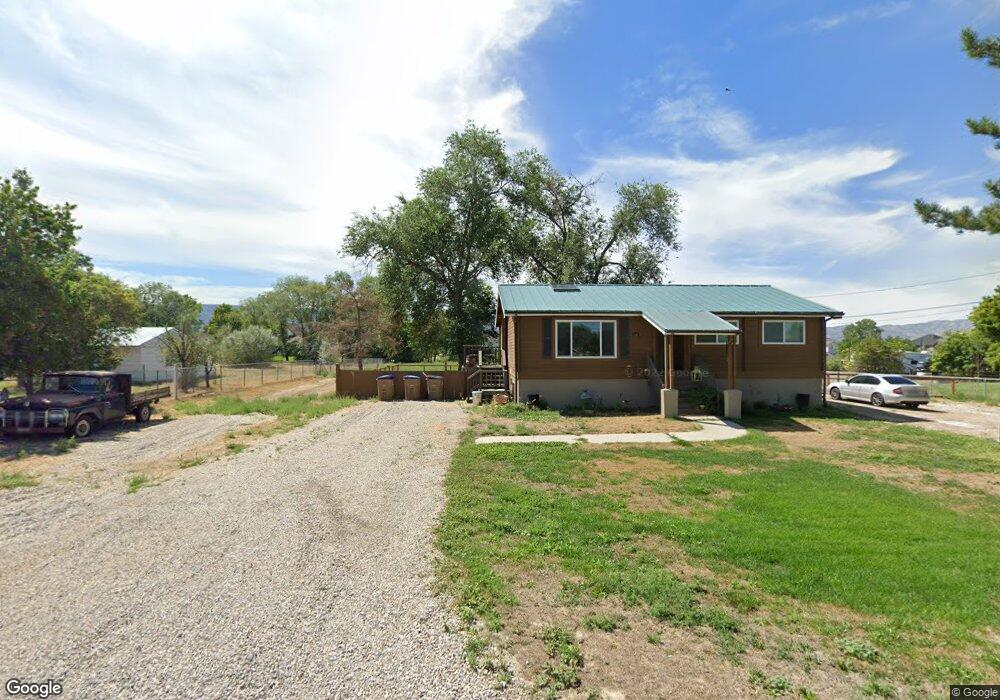
556 E 11900 S Draper, UT 84020
Estimated Value: $431,000 - $675,000
Studio
--
Bath
750
Sq Ft
$737/Sq Ft
Est. Value
About This Home
This home is located at 556 E 11900 S, Draper, UT 84020 and is currently estimated at $553,000, approximately $737 per square foot. 556 E 11900 S is a home located in Salt Lake County with nearby schools including Sprucewood School, Mount Jordan Middle School, and St John the Baptist Catholic Elementary School.
Ownership History
Date
Name
Owned For
Owner Type
Purchase Details
Closed on
Nov 16, 2021
Sold by
Can Am Logistics Inc
Bought by
Skaggs Catholic Center Llc
Current Estimated Value
Purchase Details
Closed on
Nov 10, 2021
Sold by
Can Am Logistics Inc
Bought by
Skaggs Catholic Center Llc
Purchase Details
Closed on
Oct 10, 2017
Sold by
Sullivan Brian R O and Thompson Jennifer R
Bought by
Can Am Logisticc Inc
Purchase Details
Closed on
Jan 11, 2014
Sold by
Muscari Kristin T and Hassinger Timothy D
Bought by
Osullivan Brian R and Thompson Jennifer R
Home Financials for this Owner
Home Financials are based on the most recent Mortgage that was taken out on this home.
Original Mortgage
$294,566
Interest Rate
4.4%
Mortgage Type
FHA
Purchase Details
Closed on
Jan 10, 2014
Sold by
Muscari Kristin T and Hassinger Timothy D
Bought by
Sullivan Brian R O and Thompson Jennifer R
Home Financials for this Owner
Home Financials are based on the most recent Mortgage that was taken out on this home.
Original Mortgage
$294,566
Interest Rate
4.4%
Mortgage Type
FHA
Create a Home Valuation Report for This Property
The Home Valuation Report is an in-depth analysis detailing your home's value as well as a comparison with similar homes in the area
Home Values in the Area
Average Home Value in this Area
Purchase History
| Date | Buyer | Sale Price | Title Company |
|---|---|---|---|
| Skaggs Catholic Center Llc | -- | Title One Title | |
| Skaggs Catholic Center Llc | -- | Title One | |
| Can Am Logisticc Inc | -- | Title Guarantee S Jordan | |
| Osullivan Brian R | -- | Legends Title Llc | |
| Sullivan Brian R O | -- | Legends Title Llc | |
| Osullivan Brian R | -- | Legends Title Llc |
Source: Public Records
Mortgage History
| Date | Status | Borrower | Loan Amount |
|---|---|---|---|
| Previous Owner | Osullivan Brian R | $294,566 | |
| Previous Owner | Osullivan Brian R | $294,566 |
Source: Public Records
Tax History
| Year | Tax Paid | Tax Assessment Tax Assessment Total Assessment is a certain percentage of the fair market value that is determined by local assessors to be the total taxable value of land and additions on the property. | Land | Improvement |
|---|---|---|---|---|
| 2025 | $1,460 | $159,200 | $159,200 | -- |
| 2024 | $1,460 | $153,400 | $153,400 | -- |
| 2023 | $1,447 | $150,900 | $150,900 | $0 |
| 2022 | $1,469 | $148,000 | $148,000 | $0 |
| 2021 | $1,180 | $101,500 | $101,500 | $0 |
| 2020 | $1,165 | $95,000 | $95,000 | $0 |
| 2019 | $1,192 | $95,000 | $95,000 | $0 |
| 2018 | $631 | $87,790 | $87,790 | $0 |
| 2017 | $666 | $87,790 | $87,790 | $0 |
| 2016 | $811 | $105,000 | $105,000 | $0 |
| 2015 | $646 | $78,190 | $66,190 | $12,000 |
| 2014 | $768 | $95,800 | $82,800 | $13,000 |
Source: Public Records
Map
Nearby Homes
- 12062 S 540 E
- 622 E Sawback Ln
- 11737 S Nigel Peak Ln
- 311 E Unchartered Ln
- 352 E Mistilake Ln Unit 20
- 11873 Cottage View Ln
- 11743 S 700 E
- 622 Wyngate Pointe Ln
- 654 Wyngate Pointe Ln
- 186 E Kimballfield Ln
- 604 Normandy Loop Ln
- 834 E 12085 S
- 224 E Spencer Peak Way Unit F-4
- 181 Mountain Peak Dr
- 208 Spencer Peak Way Unit E2
- 8858 S Willow Wood Dr
- 633 E Vandalay Ln
- 584 E Camden Pointe Cove
- 11544 Olive Berry Ln
- 468 E Montana Dr
Your Personal Tour Guide
Ask me questions while you tour the home.