Estimated Value: $341,000 - $439,000
2
Beds
1
Bath
1,040
Sq Ft
$363/Sq Ft
Est. Value
About This Home
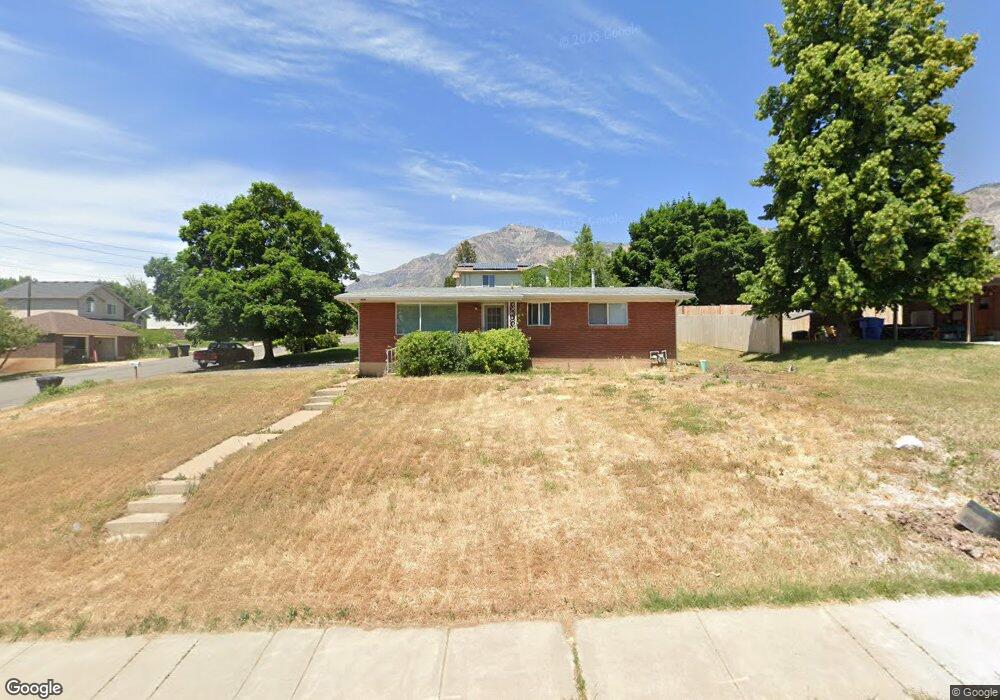
This home is located at 556 E 2600 N, Ogden, UT 84414 and is currently estimated at $377,989, approximately $363 per square foot. 556 E 2600 N is a home located in Weber County with nearby schools including North Ogden School, North Ogden Junior High School, and Weber High School.
Ownership History
Date
Name
Owned For
Owner Type
Purchase Details
Closed on
Mar 24, 2021
Sold by
Moon Heather Marie
Bought by
Whiteley Casey and Whiteley Amyi
Current Estimated Value
Home Financials for this Owner
Home Financials are based on the most recent Mortgage that was taken out on this home.
Original Mortgage
$232,800
Outstanding Balance
$208,795
Interest Rate
2.73%
Mortgage Type
New Conventional
Estimated Equity
$169,194
Purchase Details
Closed on
Dec 29, 2020
Sold by
Iverson Eric K and Iverson Marcella
Bought by
Moon Heather Marie
Purchase Details
Closed on
Aug 3, 2020
Sold by
White James L
Bought by
Iverson Eric K and Iverson Marcella
Purchase Details
Closed on
Mar 26, 2004
Sold by
Jepsen Ada S
Bought by
White James L
Home Financials for this Owner
Home Financials are based on the most recent Mortgage that was taken out on this home.
Original Mortgage
$99,900
Interest Rate
8.5%
Mortgage Type
Purchase Money Mortgage
Create a Home Valuation Report for This Property
The Home Valuation Report is an in-depth analysis detailing your home's value as well as a comparison with similar homes in the area
Home Values in the Area
Average Home Value in this Area
Purchase History
| Date | Buyer | Sale Price | Title Company |
|---|---|---|---|
| Whiteley Casey | -- | Mountain View Title Ogden | |
| Moon Heather Marie | -- | Lincoln Title Insurance Agcy | |
| Iverson Eric K | -- | Lincoln Title Insurance Agcy | |
| White James L | -- | Executive Title |
Source: Public Records
Mortgage History
| Date | Status | Borrower | Loan Amount |
|---|---|---|---|
| Open | Whiteley Casey | $232,800 | |
| Previous Owner | White James L | $99,900 |
Source: Public Records
Tax History
| Year | Tax Paid | Tax Assessment Tax Assessment Total Assessment is a certain percentage of the fair market value that is determined by local assessors to be the total taxable value of land and additions on the property. | Land | Improvement |
|---|---|---|---|---|
| 2025 | $2,274 | $323,812 | $129,413 | $194,399 |
| 2024 | $2,085 | $175,999 | $71,177 | $104,822 |
| 2023 | $2,183 | $188,100 | $71,254 | $116,846 |
| 2022 | $2,224 | $197,450 | $57,834 | $139,616 |
| 2021 | $1,657 | $249,000 | $71,033 | $177,967 |
| 2020 | $1,599 | $225,000 | $56,865 | $168,135 |
| 2019 | $1,463 | $197,000 | $47,206 | $149,794 |
| 2018 | $1,334 | $171,000 | $43,204 | $127,796 |
| 2017 | $1,222 | $147,000 | $43,307 | $103,693 |
| 2016 | $1,089 | $70,102 | $24,924 | $45,178 |
| 2015 | $984 | $62,517 | $27,546 | $34,971 |
| 2014 | $1,001 | $62,517 | $27,546 | $34,971 |
Source: Public Records
Map
Nearby Homes
- 2573 N 550 E
- 561 E 2550 N
- 2543 N 525 E
- 527 E 2500 N
- 2458 N 575 E
- 3878 N 475 E Unit 33
- 3629 N 475 E Unit 1
- 684 E 2700 N
- 692 E 2400 N
- 584 E 2300 N
- 2277 N 515 E
- 572 E 2250 N
- 2735 N 400 E
- 571 E 2250 N
- 325 E 2550 N Unit 23
- 325 E 2550 N Unit 17
- 325 E 2550 N Unit 97
- 325 E 2550 N Unit 22
- 2205 N 600 E
- 2213 N 525 E
Your Personal Tour Guide
Ask me questions while you tour the home.