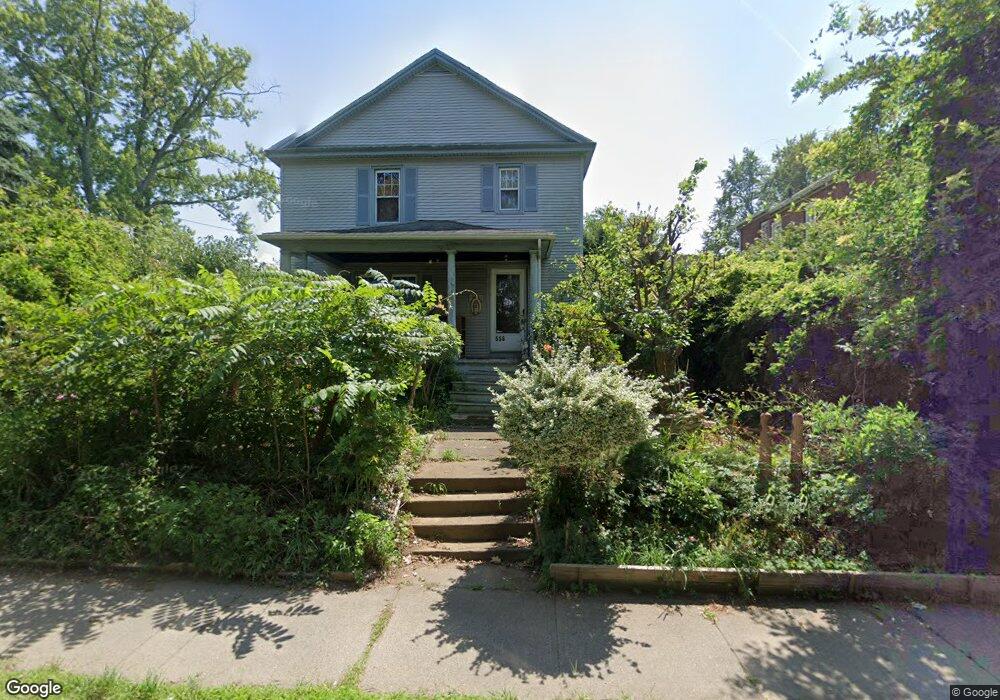
556 E Main St Chicopee, MA 01020
Chicopee Falls NeighborhoodEstimated Value: $299,097 - $346,000
About This Home
This home is located at 556 E Main St, Chicopee, MA 01020 and is currently estimated at $319,774, approximately $246 per square foot. 556 E Main St is a home located in Hampden County with nearby schools including Belcher Elementary School, Bellamy Middle School, and Chicopee High School.
Ownership History
We collect this data history from publicly available records. To have your information removed, we recommend requesting removal directly through your county’s website.
Purchase Details
Home Values in the Area
Average Home Value in this Area
Purchase History
We collect this data history from publicly available records. To have your information removed, we recommend requesting removal directly through your county’s website.
| Date | Buyer | Sale Price | Title Company |
|---|---|---|---|
| $94,000 | -- |
Mortgage History
We collect this data history from publicly available records. To have your information removed, we recommend requesting removal directly through your county’s website.
| Date | Status | Borrower | Loan Amount |
|---|---|---|---|
| Open | $79,000 | ||
| Closed | $82,000 | ||
| Closed | $85,250 |
Tax History
We collect this data history from publicly available records. To have your information removed, we recommend requesting removal directly through your county’s website.
| Year | Tax Paid | Tax Assessment Tax Assessment Total Assessment is a certain percentage of the fair market value that is determined by local assessors to be the total taxable value of land and additions on the property. | Land | Improvement |
|---|---|---|---|---|
| 2025 | $3,767 | $248,500 | $100,700 | $147,800 |
| 2024 | $3,573 | $242,100 | $98,700 | $143,400 |
| 2023 | $3,347 | $220,900 | $89,700 | $131,200 |
| 2022 | $3,196 | $188,100 | $78,000 | $110,100 |
| 2021 | $3,011 | $171,000 | $70,900 | $100,100 |
| 2020 | $2,869 | $164,300 | $70,900 | $93,400 |
| 2019 | $2,830 | $157,600 | $70,900 | $86,700 |
| 2018 | $2,743 | $149,800 | $67,500 | $82,300 |
| 2017 | $2,865 | $165,500 | $67,500 | $98,000 |
| 2016 | $2,723 | $161,000 | $67,500 | $93,500 |
| 2015 | $2,733 | $155,800 | $67,500 | $88,300 |
| 2014 | $1,366 | $155,800 | $67,500 | $88,300 |
Map
- 23 Wildermere St
- 67 Wildermere St
- 78 Glendale St
- 140 Ruskin St
- 132 Ondrick Dr
- 221 East St
- 271 Wildermere St
- 264 E Main St
- 74 Rochester St
- 283 Fuller Rd Unit I
- 283 Fuller Rd Unit T
- Lot (0) Royalton St
- 239 Fuller Rd
- 101 Frontenac St
- 44 Alvord Ave
- 41 Hicks St
- 90 Walnut St
- 20 Rathburn St
- 44 Schley St
- 147 Bowles Park
Ask me questions while you tour the home.