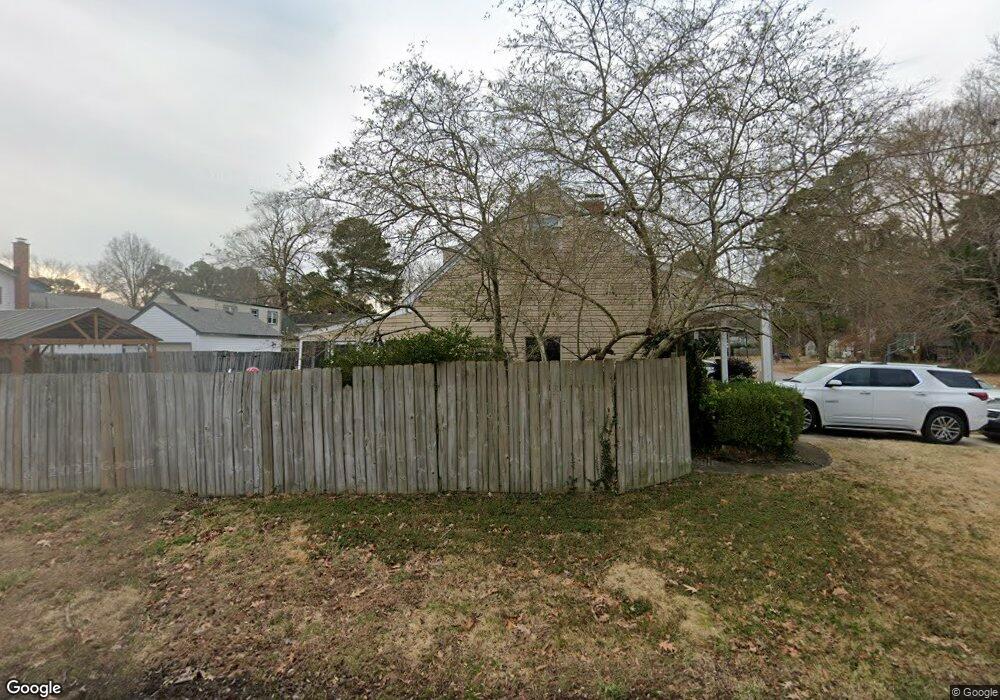
556 Harton Cir Virginia Beach, VA 23452
Little Neck NeighborhoodEstimated Value: $442,000 - $482,000
4
Beds
2
Baths
2,006
Sq Ft
$228/Sq Ft
Est. Value
About This Home
This home is located at 556 Harton Cir, Virginia Beach, VA 23452 and is currently estimated at $457,515, approximately $228 per square foot. 556 Harton Cir is a home located in Virginia Beach City with nearby schools including Malibu Elementary School, Independence Middle School, and Princess Anne High School.
Ownership History
Date
Name
Owned For
Owner Type
Purchase Details
Closed on
Feb 27, 2020
Sold by
Meador Donald E
Bought by
Roby Steven and Roby Lisa Marie
Current Estimated Value
Home Financials for this Owner
Home Financials are based on the most recent Mortgage that was taken out on this home.
Original Mortgage
$300,440
Outstanding Balance
$266,585
Interest Rate
3.6%
Mortgage Type
VA
Estimated Equity
$190,930
Purchase Details
Closed on
Apr 1, 2003
Sold by
D A B Bldg Corp
Bought by
Meador Donald
Home Financials for this Owner
Home Financials are based on the most recent Mortgage that was taken out on this home.
Original Mortgage
$162,450
Interest Rate
5.91%
Mortgage Type
FHA
Purchase Details
Closed on
Jun 27, 2002
Sold by
Specialized Inc Of V A
Bought by
D A B Bldg Corp
Home Financials for this Owner
Home Financials are based on the most recent Mortgage that was taken out on this home.
Original Mortgage
$600,000
Interest Rate
6.73%
Create a Home Valuation Report for This Property
The Home Valuation Report is an in-depth analysis detailing your home's value as well as a comparison with similar homes in the area
Home Values in the Area
Average Home Value in this Area
Purchase History
| Date | Buyer | Sale Price | Title Company |
|---|---|---|---|
| Roby Steven | $290,000 | Priority Title & Escrow | |
| Meador Donald | $165,000 | -- | |
| D A B Bldg Corp | $129,500 | -- |
Source: Public Records
Mortgage History
| Date | Status | Borrower | Loan Amount |
|---|---|---|---|
| Open | Roby Steven | $300,440 | |
| Previous Owner | Meador Donald | $162,450 | |
| Previous Owner | D A B Bldg Corp | $600,000 |
Source: Public Records
Tax History
| Year | Tax Paid | Tax Assessment Tax Assessment Total Assessment is a certain percentage of the fair market value that is determined by local assessors to be the total taxable value of land and additions on the property. | Land | Improvement |
|---|---|---|---|---|
| 2025 | $3,412 | $378,300 | $135,000 | $243,300 |
| 2024 | $3,412 | $351,800 | $120,000 | $231,800 |
| 2023 | $3,490 | $352,500 | $116,000 | $236,500 |
| 2022 | $3,053 | $308,400 | $102,000 | $206,400 |
| 2021 | $2,620 | $264,600 | $90,000 | $174,600 |
| 2020 | $2,810 | $276,200 | $92,000 | $184,200 |
| 2019 | $2,844 | $269,200 | $90,000 | $179,200 |
| 2018 | $2,699 | $269,200 | $90,000 | $179,200 |
| 2017 | $2,688 | $268,100 | $90,000 | $178,100 |
| 2016 | $2,559 | $258,500 | $90,000 | $168,500 |
| 2015 | $2,451 | $247,600 | $90,000 | $157,600 |
| 2014 | $2,168 | $239,700 | $121,500 | $118,200 |
Source: Public Records
Map
Nearby Homes
- 3828 Annie Ln
- 644 Piney Point Rd
- 500 Royal Palm Dr
- 3633 Britt Terrace
- 420 Cronin Rd
- 420 Gotham Rd
- 404 Malibu Dr
- 3944 Roebling Ln
- 409 Big Pine Dr
- 728 Prince Charles Ln
- 3937 Seeman Rd
- 508 Kingston Dr
- 675 Thalia Point Rd
- 4009 Roebling Ln
- 4213 Thalia Dr
- 4204 Robbins Ct
- 38 S Rosemont Rd
- 841 Queen Elizabeth Dr
- 812 Coverdale Ln
- 150 Majestic Cir
Your Personal Tour Guide
Ask me questions while you tour the home.