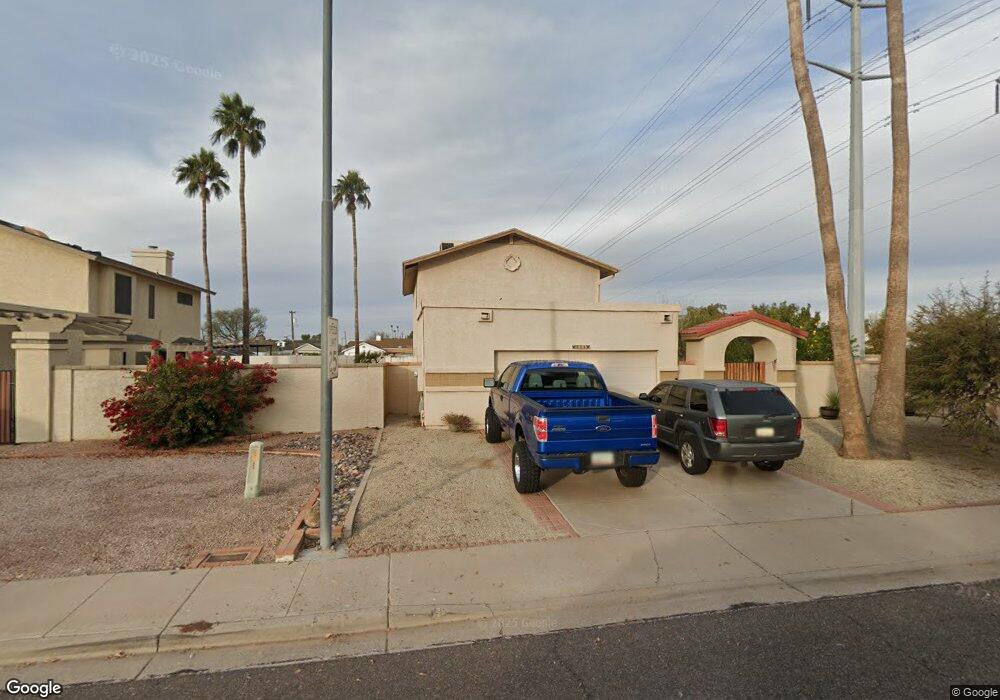
556 N Nassau Unit 2 Mesa, AZ 85205
The Groves NeighborhoodEstimated Value: $380,348 - $444,000
3
Beds
3
Baths
1,554
Sq Ft
$261/Sq Ft
Est. Value
About This Home
This home is located at 556 N Nassau Unit 2, Mesa, AZ 85205 and is currently estimated at $405,087, approximately $260 per square foot. 556 N Nassau Unit 2 is a home located in Maricopa County with nearby schools including Entz Elementary School, Franklin at Brimhall Elementary School, and Franklin West Elementary School.
Ownership History
Date
Name
Owned For
Owner Type
Purchase Details
Closed on
Mar 15, 2016
Sold by
Zaback Larry A
Bought by
Raynes Ii Jack W and Raynes Sharlene M
Current Estimated Value
Home Financials for this Owner
Home Financials are based on the most recent Mortgage that was taken out on this home.
Original Mortgage
$180,805
Outstanding Balance
$143,106
Interest Rate
3.65%
Mortgage Type
VA
Estimated Equity
$261,981
Purchase Details
Closed on
Feb 11, 2011
Sold by
Us Bank National Association Nd
Bought by
Zaback Larry A and Zaback Carolynl
Purchase Details
Closed on
Oct 19, 2010
Sold by
Siy Jsoeph
Bought by
U S Bank National Association Nd
Purchase Details
Closed on
Jul 12, 2005
Sold by
Blair Raymond L
Bought by
Siy Joseph and Siy Lourdes
Home Financials for this Owner
Home Financials are based on the most recent Mortgage that was taken out on this home.
Original Mortgage
$45,600
Interest Rate
5.56%
Mortgage Type
Stand Alone Second
Create a Home Valuation Report for This Property
The Home Valuation Report is an in-depth analysis detailing your home's value as well as a comparison with similar homes in the area
Home Values in the Area
Average Home Value in this Area
Purchase History
| Date | Buyer | Sale Price | Title Company |
|---|---|---|---|
| Raynes Ii Jack W | $177,000 | Grand Canyon Title Agency | |
| Zaback Larry A | $83,000 | First American Title Ins Co | |
| U S Bank National Association Nd | $100,000 | Accommodation | |
| Siy Joseph | $228,000 | Ticor Title Agency Of Az Inc |
Source: Public Records
Mortgage History
| Date | Status | Borrower | Loan Amount |
|---|---|---|---|
| Open | Raynes Ii Jack W | $180,805 | |
| Previous Owner | Siy Joseph | $45,600 | |
| Previous Owner | Siy Joseph | $182,400 |
Source: Public Records
Tax History Compared to Growth
Tax History
| Year | Tax Paid | Tax Assessment Tax Assessment Total Assessment is a certain percentage of the fair market value that is determined by local assessors to be the total taxable value of land and additions on the property. | Land | Improvement |
|---|---|---|---|---|
| 2025 | $1,396 | $16,424 | -- | -- |
| 2024 | $1,411 | $15,642 | -- | -- |
| 2023 | $1,411 | $29,480 | $5,890 | $23,590 |
| 2022 | $1,381 | $22,660 | $4,530 | $18,130 |
| 2021 | $1,412 | $21,900 | $4,380 | $17,520 |
| 2020 | $1,393 | $20,180 | $4,030 | $16,150 |
| 2019 | $1,292 | $17,760 | $3,550 | $14,210 |
| 2018 | $1,233 | $18,250 | $3,650 | $14,600 |
| 2017 | $1,195 | $15,230 | $3,040 | $12,190 |
| 2016 | $1,172 | $14,570 | $2,910 | $11,660 |
| 2015 | $1,296 | $13,880 | $2,770 | $11,110 |
Source: Public Records
Map
Nearby Homes
- 4126 E Covina St
- 625 N 38th St
- 4065 E University Dr Unit 261
- 4065 E University Dr Unit 157
- 4065 E University Dr Unit 8
- 4065 E University Dr Unit 271
- 4065 E University Dr Unit 564
- 4065 E University Dr Unit 510
- 4065 E University Dr Unit 576
- 4065 E University Dr Unit 4
- 4065 E University Dr Unit 471
- 4065 E University Dr Unit 344
- 4065 E University Dr Unit 476
- 4065 E University Dr Unit 115
- 4065 E University Dr Unit 58
- 4065 E University Dr Unit 341
- 4065 E University Dr Unit 287
- 4065 E University Dr Unit 528
- 4065 E University Dr Unit 436
- 4065 E University Dr Unit 433
- 548 N Nassau
- 540 N Nassau
- 4012 E Covina St
- 4012 E Covina St Unit 2
- 4016 E Covina St Unit 2
- 532 N Nassau
- 4013 E Covina St Unit 2
- 4022 E Covina St
- 557 N 39th Way
- 524 N Nassau
- 524 N Nassau
- 4017 E Covina St
- 602 N Nassau
- 4026 E Covina St
- 516 N Nassau
- 4023 E Covina St
- 3953 E Decatur St
- 543 N 39th Way
- 4014 E Contessa St Unit 2
- 4030 E Covina St