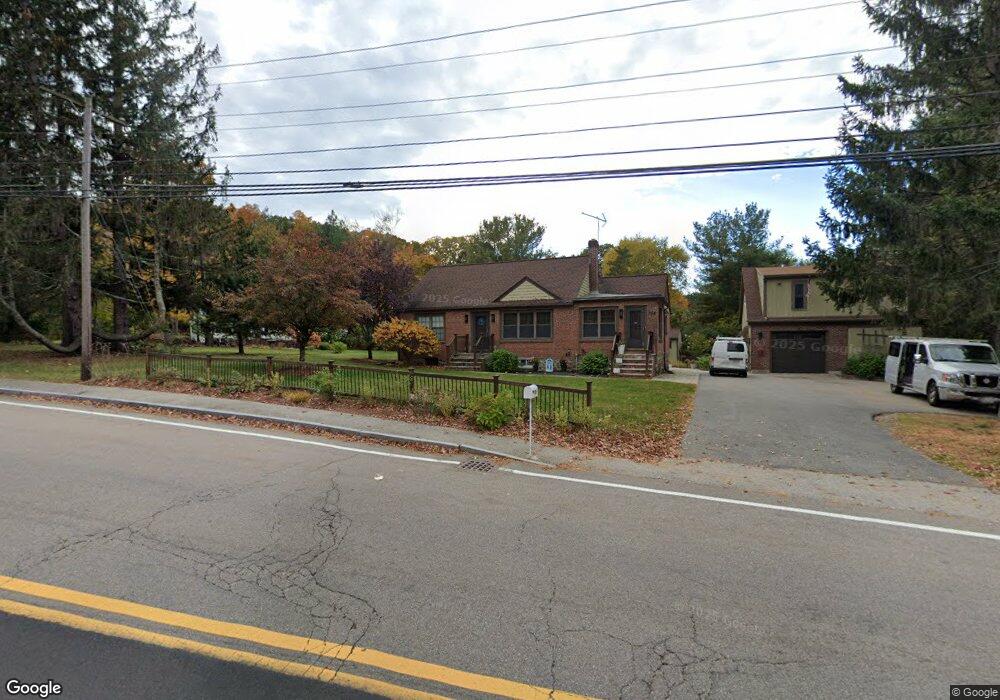
556 Pleasant St Marlborough, MA 01752
French Hill NeighborhoodEstimated Value: $563,000 - $646,000
2
Beds
3
Baths
1,363
Sq Ft
$437/Sq Ft
Est. Value
About This Home
This home is located at 556 Pleasant St, Marlborough, MA 01752 and is currently estimated at $595,655, approximately $437 per square foot. 556 Pleasant St is a home located in Middlesex County with nearby schools including Marlborough High School, New Covenant Christian School, and First Steps Children's Center.
Ownership History
Date
Name
Owned For
Owner Type
Purchase Details
Closed on
Apr 26, 2004
Sold by
Meister Barbara R and Meister Katerina R
Bought by
Fish Warren T
Current Estimated Value
Home Financials for this Owner
Home Financials are based on the most recent Mortgage that was taken out on this home.
Original Mortgage
$289,750
Outstanding Balance
$134,895
Interest Rate
5.4%
Mortgage Type
Purchase Money Mortgage
Estimated Equity
$460,760
Create a Home Valuation Report for This Property
The Home Valuation Report is an in-depth analysis detailing your home's value as well as a comparison with similar homes in the area
Home Values in the Area
Average Home Value in this Area
Purchase History
| Date | Buyer | Sale Price | Title Company |
|---|---|---|---|
| Fish Warren T | $305,000 | -- |
Source: Public Records
Mortgage History
| Date | Status | Borrower | Loan Amount |
|---|---|---|---|
| Open | Fish Warren T | $289,750 |
Source: Public Records
Tax History Compared to Growth
Tax History
| Year | Tax Paid | Tax Assessment Tax Assessment Total Assessment is a certain percentage of the fair market value that is determined by local assessors to be the total taxable value of land and additions on the property. | Land | Improvement |
|---|---|---|---|---|
| 2025 | $5,144 | $521,700 | $220,100 | $301,600 |
| 2024 | $5,176 | $505,500 | $200,200 | $305,300 |
| 2023 | $4,923 | $426,600 | $164,000 | $262,600 |
| 2022 | $4,845 | $369,300 | $156,200 | $213,100 |
| 2021 | $5,020 | $363,800 | $127,300 | $236,500 |
| 2020 | $5,023 | $354,200 | $123,500 | $230,700 |
| 2019 | $4,937 | $350,900 | $121,600 | $229,300 |
| 2018 | $7,752 | $321,100 | $106,800 | $214,300 |
| 2017 | $4,561 | $297,700 | $106,900 | $190,800 |
| 2016 | $4,458 | $290,600 | $106,900 | $183,700 |
| 2015 | $4,362 | $276,800 | $109,900 | $166,900 |
Source: Public Records
Map
Nearby Homes