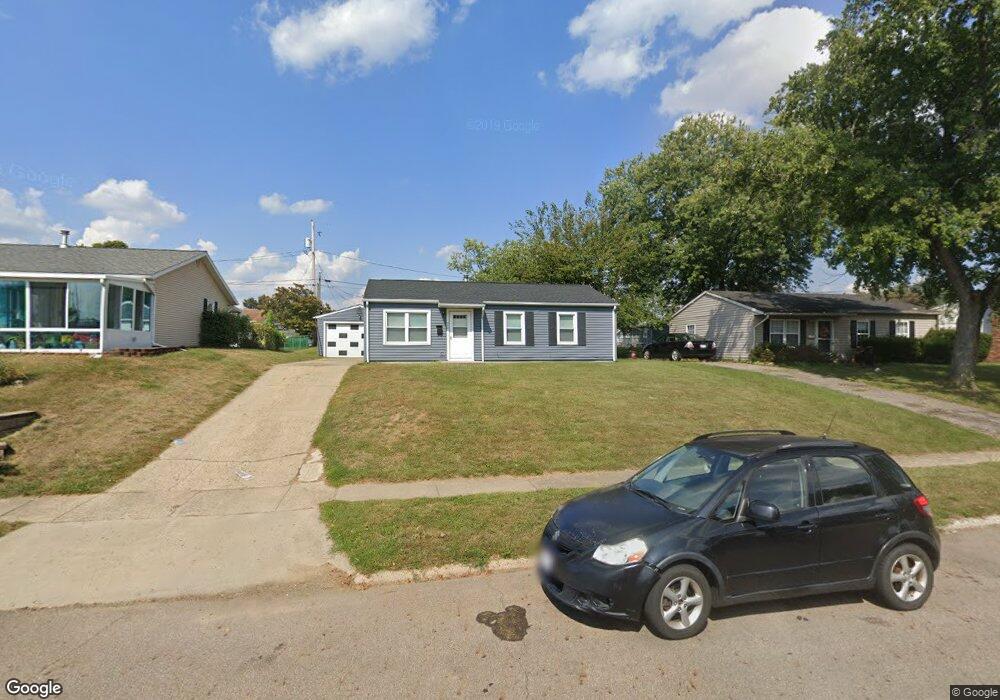
556 Ridgefield Rd Newark, OH 43055
Estimated Value: $174,000 - $192,080
3
Beds
1
Bath
925
Sq Ft
$202/Sq Ft
Est. Value
About This Home
This home is located at 556 Ridgefield Rd, Newark, OH 43055 and is currently estimated at $186,770, approximately $201 per square foot. 556 Ridgefield Rd is a home located in Licking County with nearby schools including Mcguffey Elementary School, Wilson Middle School, and Newark High School.
Ownership History
Date
Name
Owned For
Owner Type
Purchase Details
Closed on
Aug 14, 2018
Sold by
Smith Ronald A and Smith Suzanne J
Bought by
Targett Ricky P and Mccormack Melissa
Current Estimated Value
Home Financials for this Owner
Home Financials are based on the most recent Mortgage that was taken out on this home.
Original Mortgage
$50,850
Outstanding Balance
$31,826
Interest Rate
5.37%
Mortgage Type
Adjustable Rate Mortgage/ARM
Estimated Equity
$154,944
Purchase Details
Closed on
Sep 11, 2009
Sold by
Smith Miller Samantha L and Miller Virgil
Bought by
Smith Ronald A and Smith Suzanne J
Purchase Details
Closed on
Sep 30, 2003
Sold by
Lightle Dianna E
Bought by
Smith Ronald A and Smith Samantha L
Home Financials for this Owner
Home Financials are based on the most recent Mortgage that was taken out on this home.
Original Mortgage
$78,600
Interest Rate
6.4%
Mortgage Type
Unknown
Create a Home Valuation Report for This Property
The Home Valuation Report is an in-depth analysis detailing your home's value as well as a comparison with similar homes in the area
Home Values in the Area
Average Home Value in this Area
Purchase History
| Date | Buyer | Sale Price | Title Company |
|---|---|---|---|
| Targett Ricky P | $56,500 | None Available | |
| Smith Ronald A | -- | Attorney | |
| Smith Ronald A | $75,500 | -- |
Source: Public Records
Mortgage History
| Date | Status | Borrower | Loan Amount |
|---|---|---|---|
| Open | Targett Ricky P | $50,850 | |
| Previous Owner | Smith Ronald A | $78,600 |
Source: Public Records
Tax History Compared to Growth
Tax History
| Year | Tax Paid | Tax Assessment Tax Assessment Total Assessment is a certain percentage of the fair market value that is determined by local assessors to be the total taxable value of land and additions on the property. | Land | Improvement |
|---|---|---|---|---|
| 2024 | $1,371 | $38,330 | $15,370 | $22,960 |
| 2023 | $1,369 | $38,330 | $15,370 | $22,960 |
| 2022 | $1,318 | $32,800 | $8,580 | $24,220 |
| 2021 | $1,382 | $32,800 | $8,580 | $24,220 |
| 2020 | $1,413 | $32,800 | $8,580 | $24,220 |
| 2019 | $1,158 | $25,870 | $8,580 | $17,290 |
| 2018 | $1,189 | $0 | $0 | $0 |
| 2017 | $1,197 | $0 | $0 | $0 |
| 2016 | $1,229 | $0 | $0 | $0 |
| 2015 | $1,256 | $0 | $0 | $0 |
| 2014 | $1,566 | $0 | $0 | $0 |
| 2013 | $1,193 | $0 | $0 | $0 |
Source: Public Records
Map
Nearby Homes
- 550 Ridgefield Rd
- 562 Ridgefield Rd
- 557 Edgewood Dr
- 568 Ridgefield Rd
- 551 Edgewood Dr
- 563 Edgewood Dr
- 553 Ridgefield Rd
- 569 Edgewood Dr
- 559 Ridgefield Rd
- 549 Ridgefield Rd
- 574 Ridgefield Rd
- 565 Ridgefield Rd
- 545 Ridgefield Rd
- 539 Edgewood Dr
- 575 Edgewood Dr
- 571 Ridgefield Rd
- 527 Ridgefield Rd
- 580 Ridgefield Rd
- 541 Ridgefield Rd
- 577 Ridgefield Rd