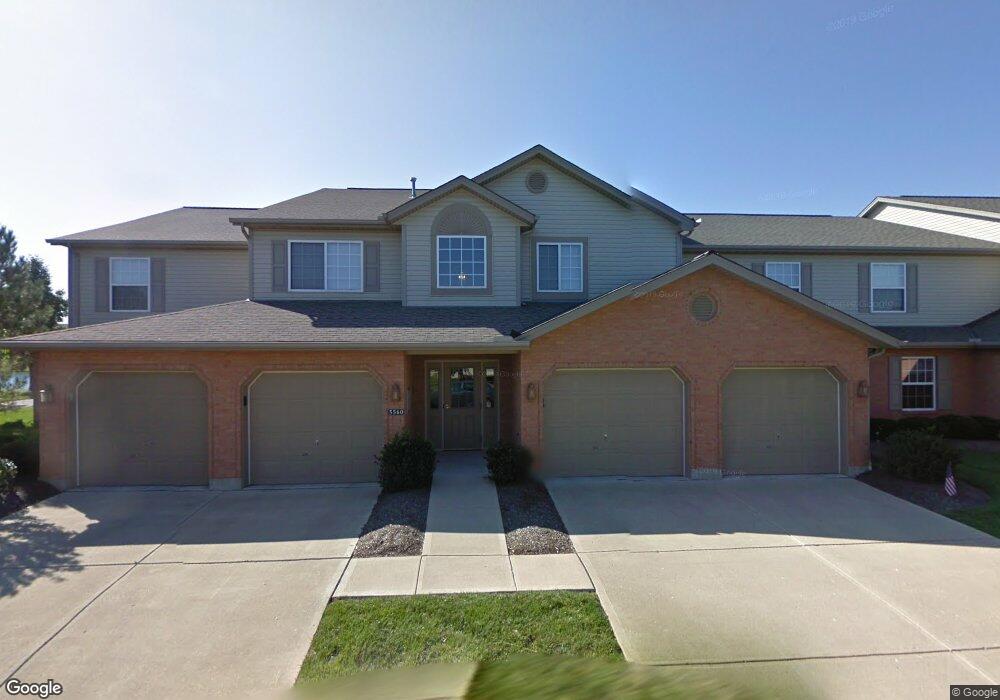
5560 Harbourwatch Way Unit 101 Mason, OH 45040
Deerfield Township NeighborhoodEstimated Value: $262,709 - $273,000
2
Beds
2
Baths
--
Sq Ft
305
Sq Ft Lot
About This Home
This home is located at 5560 Harbourwatch Way Unit 101, Mason, OH 45040 and is currently estimated at $267,927. 5560 Harbourwatch Way Unit 101 is a home located in Warren County with nearby schools including Mason Intermediate Elementary School, Mason Middle School, and William Mason High School.
Ownership History
Date
Name
Owned For
Owner Type
Purchase Details
Closed on
Jun 3, 2025
Sold by
Lemire John A
Bought by
Sucato Ilde D
Current Estimated Value
Purchase Details
Closed on
May 25, 2022
Sold by
Lemire Karen T
Bought by
Lemire John A
Purchase Details
Closed on
Sep 23, 2011
Sold by
Dunn Patricia G and Dunn Jacqueline H
Bought by
Lemire John A
Purchase Details
Closed on
Sep 21, 2005
Sold by
Yingling Connie S and Yingling Fred G
Bought by
Dunn Patricia G and Dunn Jacqueline H
Home Financials for this Owner
Home Financials are based on the most recent Mortgage that was taken out on this home.
Original Mortgage
$110,400
Interest Rate
5.93%
Mortgage Type
Fannie Mae Freddie Mac
Purchase Details
Closed on
May 20, 2002
Sold by
Harbour Watch Llc
Bought by
Reitler Josephine E and Reitler Connie S
Create a Home Valuation Report for This Property
The Home Valuation Report is an in-depth analysis detailing your home's value as well as a comparison with similar homes in the area
Home Values in the Area
Average Home Value in this Area
Purchase History
| Date | Buyer | Sale Price | Title Company |
|---|---|---|---|
| Sucato Ilde D | $280,000 | Absolute Title | |
| Lemire John A | -- | Alexander Christopher M | |
| Lemire John A | $117,500 | Stonebridge Land Title Agenc | |
| Dunn Patricia G | $138,000 | Rels Title | |
| Reitler Josephine E | $133,900 | -- |
Source: Public Records
Mortgage History
| Date | Status | Borrower | Loan Amount |
|---|---|---|---|
| Previous Owner | Dunn Patricia G | $110,400 |
Source: Public Records
Tax History Compared to Growth
Tax History
| Year | Tax Paid | Tax Assessment Tax Assessment Total Assessment is a certain percentage of the fair market value that is determined by local assessors to be the total taxable value of land and additions on the property. | Land | Improvement |
|---|---|---|---|---|
| 2024 | $177 | $4,070 | $180 | $3,890 |
| 2023 | $188 | $3,619 | $217 | $3,402 |
| 2022 | $188 | $3,619 | $217 | $3,402 |
| 2021 | $179 | $3,619 | $217 | $3,402 |
| 2020 | $172 | $2,940 | $175 | $2,765 |
| 2019 | $160 | $2,940 | $175 | $2,765 |
| 2018 | $160 | $2,940 | $175 | $2,765 |
| 2017 | $130 | $2,212 | $158 | $2,055 |
| 2016 | $134 | $2,212 | $158 | $2,055 |
| 2015 | $134 | $2,212 | $158 | $2,055 |
| 2014 | $136 | $2,070 | $150 | $1,920 |
| 2013 | $136 | $2,460 | $180 | $2,280 |
Source: Public Records
Map
Nearby Homes
- 5398 Harbourwatch Way
- 5626 Baywatch Way
- 5661 Baywatch Way
- 5339 Mapledale Way
- 8421 Cameron Ct
- 7693 Misty Springs Ct
- 7648 Waterfront Way
- 7660 Waterfront Way
- 7692 Waterfront Way
- 7600 Waterfront Way
- 5369 N Shore Place
- 7725 Livingston Dr
- 8659 Coveview Ct
- 7858 Yellowwood Dr
- 5532 Winding Cape Way
- 4765 Mallard Creek Dr
- 7911 Meadowbrook Dr
- 5641 Melbury Ct
- 7839 Meadowbrook Dr
- 7531 Kousa Ct
- 5560 Harbourwatch Way Unit 201
- 5560 Harbourwatch Way
- 5560 Harbourwatch Way Unit 101
- 5560 Harbourwatch Way Unit 102
- 5560 Harbourwatch Way Unit 201
- 5560 Harbourwatch Way
- 5548 Harbourwatch Way Unit 203
- 5548 Harbourwatch Way
- 5548 Harbourwatch Way Unit 103
- 5548 Harbourwatch Way Unit 204
- 5548 Harbourwatch Way Unit 203
- 5548 Harbourwatch Way Unit G143
- 5548 Harbourwatch Way Unit 204
- 5548 Harbourwatch Way Unit 104
- 5570 Harbourwatch Way Unit 230
- 5570 Harbourwatch Way Unit 104
- 5570 Harbourwatch Way
- 5570 Harbourwatch Way Unit 104
- 5570 Harbourwatch Way Unit 204
- 5570 Harbourwatch Way Unit 103