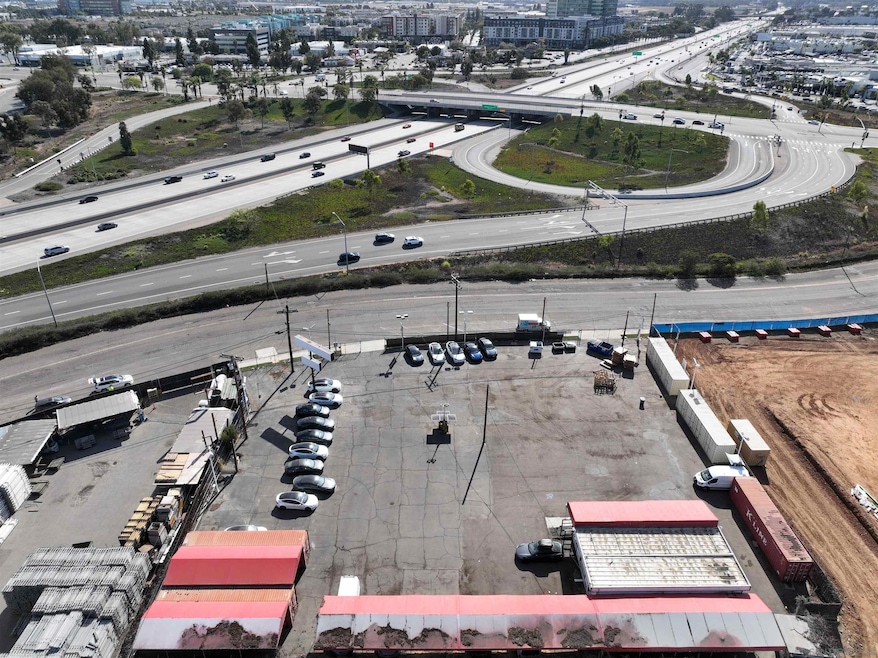
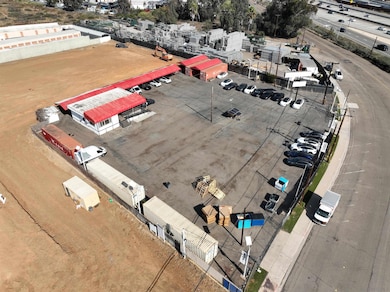
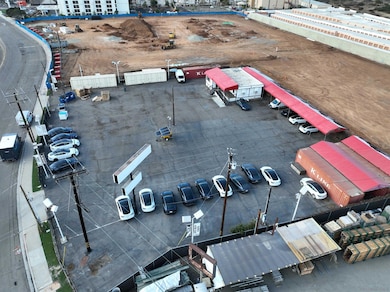
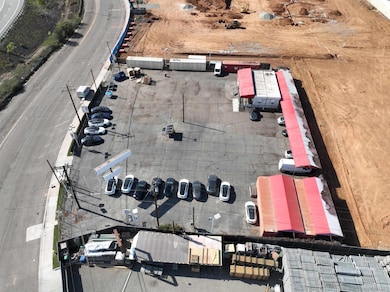
5560 Kearny Mesa Rd San Diego, CA 92111
Kearny Mesa NeighborhoodEstimated payment $35,700/month
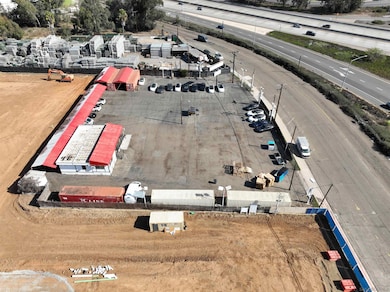
About This Lot
** SIGNIFICANT PRICE REDUCTION &HIGHLY MOTIVATED SELLER** I am excided to present a fantastic investment opportunity for a Investor or/and a Developer at 5560 Kearny Mesa Road. This property is located in the heart of Clairmont Re-Development Corridor. Property is currently under a substantial Triple Net lease contract with a High Brand Tenant offering a Cap of 9% return on Investment. This property is located near the newly Multi Residential Development. Suitable for Senior Assisted Living Development or Multi Residential projects
Listing Agent
Siamak T. Rahmani, Broker License #01027325 Listed on: 12/10/2024
Property Details
Property Type
- Land
Est. Annual Taxes
- $17,705
Lot Details
- 0.89 Acre Lot
Listing and Financial Details
- Assessor Parcel Number 356-030-39-00
Map
Home Values in the Area
Average Home Value in this Area
Tax History
| Year | Tax Paid | Tax Assessment Tax Assessment Total Assessment is a certain percentage of the fair market value that is determined by local assessors to be the total taxable value of land and additions on the property. | Land | Improvement |
|---|---|---|---|---|
| 2025 | $18,103 | $1,502,303 | $1,472,261 | $30,042 |
| 2024 | $18,103 | $1,472,847 | $1,443,394 | $29,453 |
| 2023 | $17,705 | $1,443,969 | $1,415,093 | $28,876 |
| 2022 | $17,235 | $1,415,657 | $1,387,347 | $28,310 |
| 2021 | $17,117 | $1,387,900 | $1,360,145 | $27,755 |
| 2020 | $16,909 | $1,373,670 | $1,346,199 | $27,471 |
| 2019 | $16,607 | $1,346,736 | $1,319,803 | $26,933 |
| 2018 | $15,524 | $1,320,330 | $1,293,925 | $26,405 |
| 2017 | $15,155 | $1,294,442 | $1,268,554 | $25,888 |
| 2016 | $14,917 | $1,269,062 | $1,243,681 | $25,381 |
| 2015 | $16,169 | $1,375,392 | $1,358,778 | $16,614 |
| 2014 | $14,002 | $1,186,406 | $1,186,406 | $0 |
Property History
| Date | Event | Price | List to Sale | Price per Sq Ft |
|---|---|---|---|---|
| 04/28/2025 04/28/25 | Price Changed | $6,500,000 | -10.1% | -- |
| 12/10/2024 12/10/24 | For Sale | $7,229,000 | -- | -- |
Purchase History
| Date | Type | Sale Price | Title Company |
|---|---|---|---|
| Grant Deed | $1,250,000 | First American Title Company | |
| Interfamily Deed Transfer | -- | -- | |
| Quit Claim Deed | -- | -- | |
| Quit Claim Deed | -- | -- | |
| Deed | $750,000 | -- |
Mortgage History
| Date | Status | Loan Amount | Loan Type |
|---|---|---|---|
| Closed | $687,500 | Commercial |
Source: San Diego MLS
MLS Number: 240028218
APN: 356-030-39
Disclaimer: Certain information contained herein is derived from information provided by parties other than Homes.com. All information provided is deemed reliable, but is not guaranteed to be accurate and should be independently verified.
![]() This information is deemed reliable but not guaranteed. You should rely on this information only to decide whether or not to further investigate a particular property.
This information is deemed reliable but not guaranteed. You should rely on this information only to decide whether or not to further investigate a particular property.
BEFORE MAKING ANY OTHER DECISION, YOU SHOULD PERSONALLY INVESTIGATE THE FACTS (e.g. square footage and lot size) with the assistance of an appropriate professional. You may use this information only to identify properties you may be interested in investigating further. All uses except for personal, noncommercial use in accordance with the foregoing purpose are prohibited. Redistribution or copying of this information, any photographs or video tours is strictly
prohibited. This information is derived from the Internet Data Exchange (IDX) service provided by San Diego MLS. Displayed property listings may be held by a brokerage firm other than the broker and/or agent responsible for this display. The information and any photographs and video tours and the compilation from which they are derived is protected by copyright. Compilation © 2025 San Diego MLS.
- 8783 Parkplace Ct
- 4106 Dellwood St
- 5358 Caminito Velasquez
- 9722 Caminito de la Fada
- 5288 Caminito Aruba
- 9788 Canforero Terrace
- 6460 Convoy Ct Unit SPC 59
- 6460 Convoy Ct Unit 133
- 6460 Convoy Ct Unit 185
- 6460 Convoy Ct Unit SPC 318
- 5236 Guinda Ct
- 6939 Bettyhill Dr
- 5283 Edge Park Way
- 6907 Bettyhill Dr
- 4410 Charger Blvd
- 10165 Gayuba Ln Unit 311
- 5449 Escarchosa Ln
- 4018 Hatton St
- 3735 Budd St
- 5367 Outlook Point
- 4890 Sunroad Centrum Ln
- 4855 Ariva Way
- 4890 Sunroad Centrum Ln Unit ID1266025P
- 4890 Sunroad Centrum Ln Unit ID1266048P
- 4890 Sunroad Centrum Ln Unit ID1266054P
- 4890 Sunroad Centrum Ln Unit ID1266011P
- 8725 Ariva Ct
- 4952 Haight Terrace
- 4855 Ariva Way Unit ID1266157P
- 4855 Ariva Way Unit ID1266154P
- 4855 Ariva Way Unit ID1266143P
- 4888 Convoy St
- 4068 Armstrong St Unit ADU
- 5244 Edge Park Way
- 8583 Aero Dr
- 7460 Batista St Unit Bedroom 1
- 3585 Aero Ct
- 3781 Ashford St Unit B
- 3781 Ashford St Unit A
- 4355 Cannington Dr Unit ID1024480P
