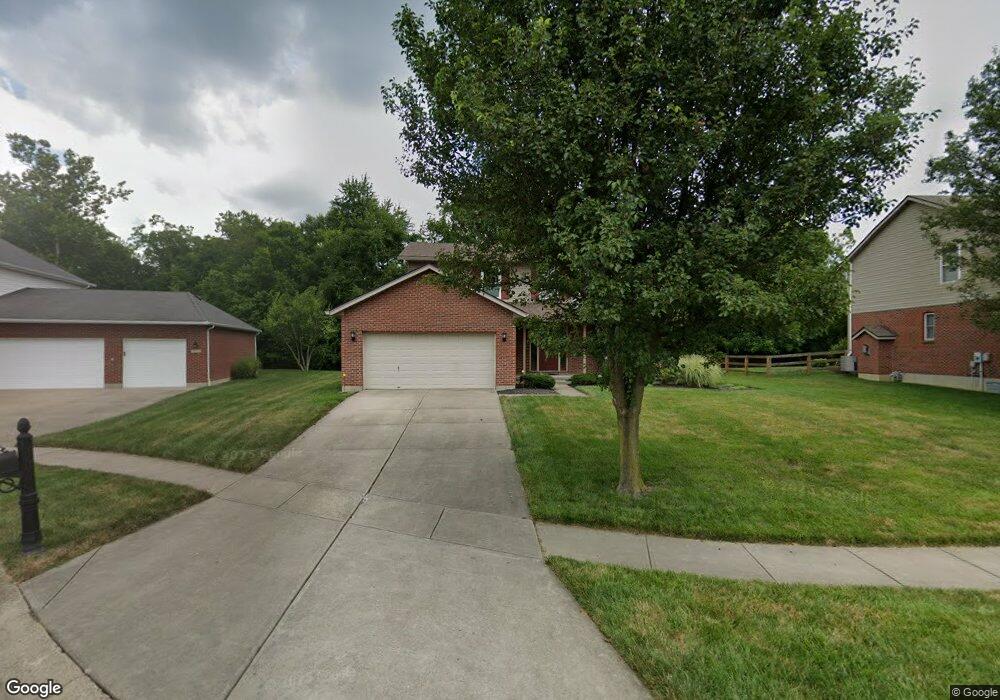
5562 Safari Dr Liberty Township, OH 45044
Estimated Value: $439,952 - $468,000
4
Beds
4
Baths
2,062
Sq Ft
$223/Sq Ft
Est. Value
About This Home
This home is located at 5562 Safari Dr, Liberty Township, OH 45044 and is currently estimated at $459,238, approximately $222 per square foot. 5562 Safari Dr is a home located in Butler County with nearby schools including VanGorden Elementary School, Liberty Junior School, and Lakota East High School.
Ownership History
Date
Name
Owned For
Owner Type
Purchase Details
Closed on
Mar 9, 2022
Sold by
Renee Maynard Pamela and Renee Wayne Kenneth
Bought by
Stephenson Grant B
Current Estimated Value
Purchase Details
Closed on
Oct 18, 2008
Sold by
Murray P Scott and Murray Lori S
Bought by
Stephenson Grant B and Stephenson Pamela Renee
Home Financials for this Owner
Home Financials are based on the most recent Mortgage that was taken out on this home.
Original Mortgage
$209,000
Interest Rate
6.48%
Mortgage Type
Purchase Money Mortgage
Purchase Details
Closed on
Jun 20, 2003
Sold by
D L Gehlrich Llc
Bought by
Murray P Scott and Murray Lori S
Home Financials for this Owner
Home Financials are based on the most recent Mortgage that was taken out on this home.
Original Mortgage
$148,325
Interest Rate
5.4%
Mortgage Type
Purchase Money Mortgage
Create a Home Valuation Report for This Property
The Home Valuation Report is an in-depth analysis detailing your home's value as well as a comparison with similar homes in the area
Home Values in the Area
Average Home Value in this Area
Purchase History
| Date | Buyer | Sale Price | Title Company |
|---|---|---|---|
| Stephenson Grant B | -- | Trokhan Cynamon T | |
| Stephenson Grant B | -- | None Listed On Document | |
| Stephenson Grant B | $220,000 | Attorney | |
| Murray P Scott | $176,342 | -- |
Source: Public Records
Mortgage History
| Date | Status | Borrower | Loan Amount |
|---|---|---|---|
| Previous Owner | Stephenson Grant B | $209,000 | |
| Previous Owner | Murray P Scott | $148,325 |
Source: Public Records
Tax History Compared to Growth
Tax History
| Year | Tax Paid | Tax Assessment Tax Assessment Total Assessment is a certain percentage of the fair market value that is determined by local assessors to be the total taxable value of land and additions on the property. | Land | Improvement |
|---|---|---|---|---|
| 2024 | $4,559 | $114,470 | $19,600 | $94,870 |
| 2023 | $4,500 | $110,160 | $19,600 | $90,560 |
| 2022 | $4,049 | $80,550 | $19,600 | $60,950 |
| 2021 | $4,028 | $80,550 | $19,600 | $60,950 |
| 2020 | $4,128 | $80,550 | $19,600 | $60,950 |
| 2019 | $6,733 | $69,900 | $19,590 | $50,310 |
| 2018 | $3,968 | $69,900 | $19,590 | $50,310 |
| 2017 | $4,032 | $69,900 | $19,590 | $50,310 |
| 2016 | $3,719 | $64,130 | $19,590 | $44,540 |
| 2015 | $3,686 | $64,130 | $19,590 | $44,540 |
| 2014 | $3,978 | $64,130 | $19,590 | $44,540 |
| 2013 | $3,978 | $66,070 | $19,590 | $46,480 |
Source: Public Records
Map
Nearby Homes
- 5542 Safari Dr
- 6534 Justess Ln
- 6551 Lucky Ln
- 6466 Winding Oaks Dr
- 6394 Ashdale Ct
- 6035 Kyles Station Rd
- 5502 Rodeo Dr
- 6777 Mahogany Ct
- 5725 Hawthrone Reserve Dr
- 6895 Welney Run
- 5051 Cavendish Dr
- 5798 Roden Park Dr
- 6512 Devon Dr
- 6226 Richards Dr
- 7025 Welney Run
- 6581 Devon Dr
- 7081 Yankee Estates Dr
- BUCHANAN Plan at Hughes Retreat
- PARKETTE Plan at Hughes Retreat
- VANDERBURGH Plan at Hughes Retreat
- 5572 Safari Dr
- 5552 Safari Dr
- 5582 Safari Dr
- 5569 Safari Dr
- 5559 Safari Dr
- 5539 Safari Dr
- 5592 Safari Dr
- 5589 Safari Dr
- 5555 Liberty Pass Dr
- 5545 Liberty Pass Dr
- 5602 Safari Dr
- 6344 Puma Ct
- 5565 Liberty Pass Dr
- 5575 Liberty Pass Dr
- 5558 Panther Run
- 6334 Puma Ct
- 5548 Panther Run
- 5612 Safari Dr
- 5538 Liberty Pass Dr
- 5538 Panther Run