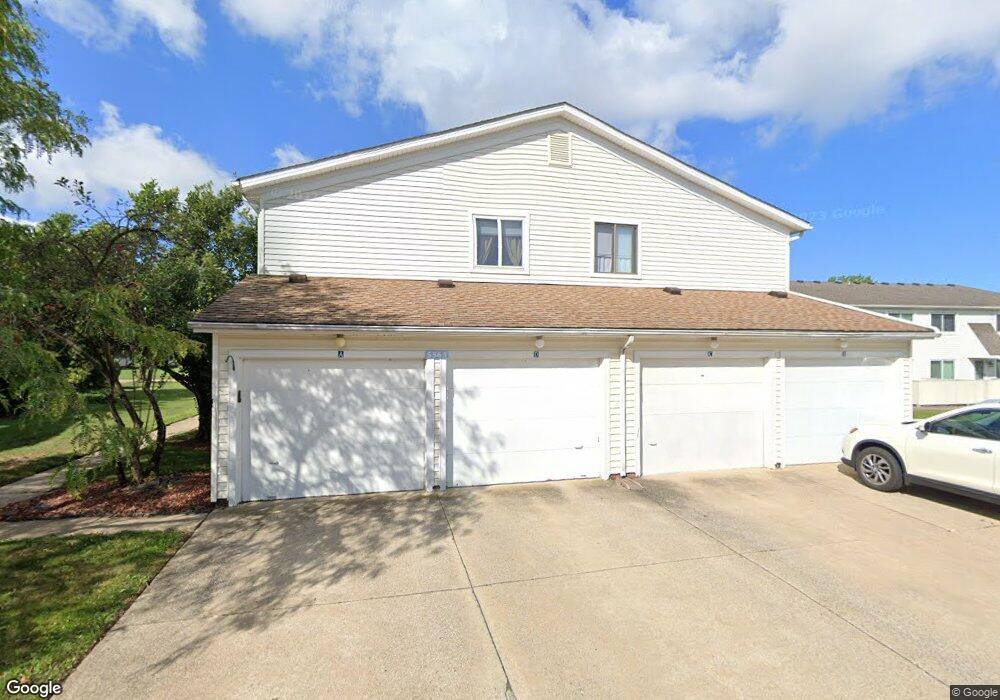
5563 Heathergreen Ct Unit C25 Willoughby, OH 44094
Downtown Willoughby NeighborhoodEstimated Value: $151,712 - $159,000
2
Beds
2
Baths
489
Sq Ft
$317/Sq Ft
Est. Value
About This Home
This home is located at 5563 Heathergreen Ct Unit C25, Willoughby, OH 44094 and is currently estimated at $154,928, approximately $316 per square foot. 5563 Heathergreen Ct Unit C25 is a home located in Lake County with nearby schools including Edison Elementary School, Willoughby Middle School, and South High School.
Ownership History
Date
Name
Owned For
Owner Type
Purchase Details
Closed on
Nov 12, 2021
Sold by
Vaccariello Matthew A
Bought by
Malysa Viktoriia L
Current Estimated Value
Purchase Details
Closed on
Oct 1, 2018
Sold by
Guhde Donna
Bought by
Vaccariello Matthew A
Home Financials for this Owner
Home Financials are based on the most recent Mortgage that was taken out on this home.
Original Mortgage
$90,250
Interest Rate
4.5%
Mortgage Type
New Conventional
Purchase Details
Closed on
Apr 26, 2018
Sold by
U S Bank National Association
Bought by
Guhde Donna
Purchase Details
Closed on
Nov 25, 2017
Sold by
Speroff Patricia J
Bought by
Us Bank National Association and Residental Asset Mortage Products Inc
Purchase Details
Closed on
Jun 16, 1977
Bought by
Speroff Robert E
Create a Home Valuation Report for This Property
The Home Valuation Report is an in-depth analysis detailing your home's value as well as a comparison with similar homes in the area
Home Values in the Area
Average Home Value in this Area
Purchase History
| Date | Buyer | Sale Price | Title Company |
|---|---|---|---|
| Malysa Viktoriia L | $129,000 | None Available | |
| Vaccariello Matthew A | $95,000 | Revere Title | |
| Guhde Donna | $62,150 | None Available | |
| Us Bank National Association | -- | None Available | |
| Speroff Patricia J | -- | None Available | |
| Speroff Robert E | -- | -- |
Source: Public Records
Mortgage History
| Date | Status | Borrower | Loan Amount |
|---|---|---|---|
| Previous Owner | Vaccariello Matthew A | $90,250 |
Source: Public Records
Tax History Compared to Growth
Tax History
| Year | Tax Paid | Tax Assessment Tax Assessment Total Assessment is a certain percentage of the fair market value that is determined by local assessors to be the total taxable value of land and additions on the property. | Land | Improvement |
|---|---|---|---|---|
| 2024 | -- | $40,110 | $13,860 | $26,250 |
| 2023 | $3,109 | $32,840 | $11,740 | $21,100 |
| 2022 | $2,039 | $32,840 | $11,740 | $21,100 |
| 2021 | $2,046 | $32,840 | $11,740 | $21,100 |
| 2020 | $1,885 | $26,920 | $9,630 | $17,290 |
| 2019 | $1,751 | $26,920 | $9,630 | $17,290 |
| 2018 | $1,767 | $23,080 | $6,620 | $16,460 |
| 2017 | $1,004 | $23,080 | $6,620 | $16,460 |
| 2016 | $1,000 | $23,080 | $6,620 | $16,460 |
| 2015 | $933 | $23,080 | $6,620 | $16,460 |
| 2014 | $885 | $23,080 | $6,620 | $16,460 |
| 2013 | $885 | $23,080 | $6,620 | $16,460 |
Source: Public Records
Map
Nearby Homes
- 5551 Ivy Ct Unit A
- 5520 Bretton Ct
- 5463 Millwood Ln Unit 42C
- 5461 Millwood Ln
- 5465 Millwood Ln Unit 40-C
- 5510 Wildwood Ct Unit 81-A
- 34840 Aspen Wood Ln
- 34675 Oak Tree Dr
- 35005 Lisle Ct
- 30871 Harrison Rd
- 5451 Oak Ridge Dr
- 5785 Royal Dr
- 1705 Douglas Rd
- 5362 Oak Ridge Dr
- 5143 Shepherds Glen Unit 41
- 30811 Grant St
- 34210 Beacon Dr
- 1431 Birdie Ln
- 34615 Ethan Way
- 34990 N Turtle Trail Unit C
- 5563 Heathergreen Ct Unit 25-C
- 5563 Heathergreen Ct Unit D25
- 5563 Heathergreen Ct Unit B25
- 5563 Heathergreen Ct Unit A25
- 5563 Heathergreen Ct Unit D
- 5562 Heathergreen Ct Unit D23
- 5562 Heathergreen Ct Unit C23
- 5562 Heathergreen Ct Unit B23
- 5562 Heathergreen Ct Unit A23
- 5562 Heathergreen Ct Unit 23-B
- 5562 Heathergreen Ct Unit C
- 5562 Heathergreen Ct Unit A
- 5562 Heathergreen Ct Unit 23A
- 5561 Heathergreen Ct Unit 24-D
- 5561 Heathergreen Ct Unit D24
- 5561 Heathergreen Ct Unit C24
- 5561 Heathergreen Ct Unit B24
- 5561 Heathergreen Ct Unit A24
- 5561 Heathergreen Ct Unit D
- 5561 Heathergreen Ct Unit 24-A