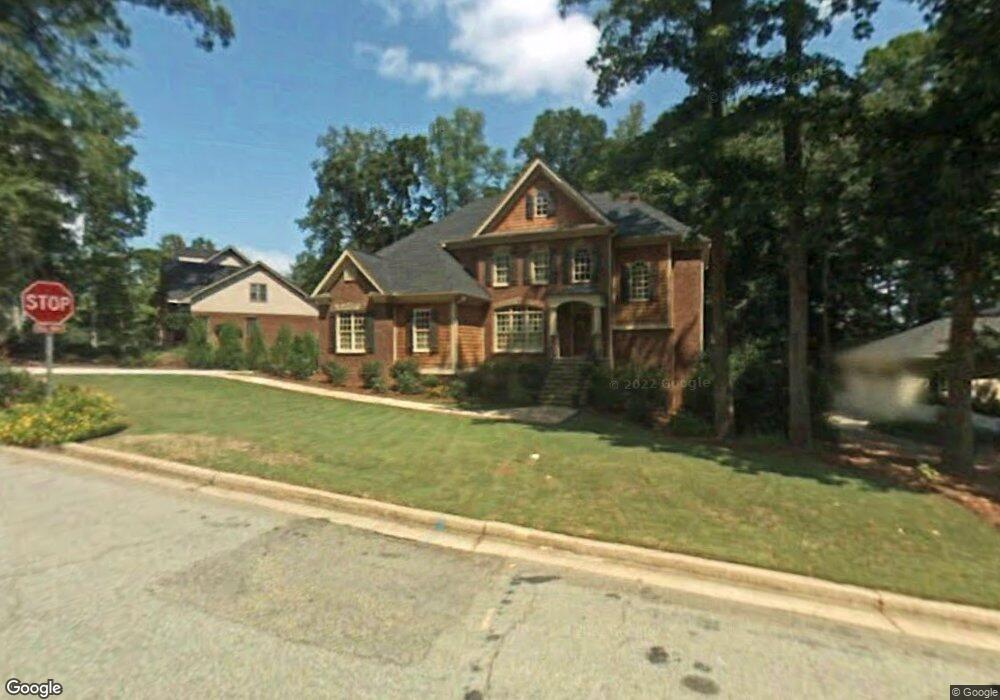
5565 Fort Fisher Way Norcross, GA 30092
Estimated Value: $798,000 - $976,000
4
Beds
4
Baths
3,461
Sq Ft
$255/Sq Ft
Est. Value
About This Home
This home is located at 5565 Fort Fisher Way, Norcross, GA 30092 and is currently estimated at $882,700, approximately $255 per square foot. 5565 Fort Fisher Way is a home located in Gwinnett County with nearby schools including Simpson Elementary School, Pinckneyville Middle School, and Norcross High School.
Ownership History
Date
Name
Owned For
Owner Type
Purchase Details
Closed on
Jul 1, 2014
Sold by
Carlock Phil Harris
Bought by
Hardy Wesley A and Hardy Blair
Current Estimated Value
Home Financials for this Owner
Home Financials are based on the most recent Mortgage that was taken out on this home.
Original Mortgage
$417,000
Outstanding Balance
$316,250
Interest Rate
4.2%
Mortgage Type
New Conventional
Estimated Equity
$566,450
Purchase Details
Closed on
Jan 30, 2008
Sold by
Johnson Thomas H and Johnson Donna A
Bought by
Carlock Phil H
Home Financials for this Owner
Home Financials are based on the most recent Mortgage that was taken out on this home.
Original Mortgage
$300,000
Interest Rate
4.88%
Mortgage Type
New Conventional
Purchase Details
Closed on
Jun 19, 2006
Sold by
Mike Williamson Homes Llc
Bought by
Johnson Thomas H and Johnson Donna A
Purchase Details
Closed on
Mar 31, 2005
Sold by
Smith Susan A
Bought by
Mike Williamson Homes Llc
Home Financials for this Owner
Home Financials are based on the most recent Mortgage that was taken out on this home.
Original Mortgage
$112,000
Interest Rate
6.75%
Create a Home Valuation Report for This Property
The Home Valuation Report is an in-depth analysis detailing your home's value as well as a comparison with similar homes in the area
Home Values in the Area
Average Home Value in this Area
Purchase History
| Date | Buyer | Sale Price | Title Company |
|---|---|---|---|
| Hardy Wesley A | $635,000 | -- | |
| Carlock Phil H | $575,000 | -- | |
| Johnson Thomas H | $605,000 | -- | |
| Mike Williamson Homes Llc | $137,000 | -- |
Source: Public Records
Mortgage History
| Date | Status | Borrower | Loan Amount |
|---|---|---|---|
| Open | Hardy Wesley A | $417,000 | |
| Closed | Hardy Wesley A | $122,750 | |
| Previous Owner | Carlock Phil H | $300,000 | |
| Previous Owner | Mike Williamson Homes Llc | $112,000 |
Source: Public Records
Tax History Compared to Growth
Tax History
| Year | Tax Paid | Tax Assessment Tax Assessment Total Assessment is a certain percentage of the fair market value that is determined by local assessors to be the total taxable value of land and additions on the property. | Land | Improvement |
|---|---|---|---|---|
| 2025 | $12,604 | $354,520 | $50,160 | $304,360 |
| 2024 | $11,641 | $323,520 | $50,000 | $273,520 |
| 2023 | $11,641 | $323,520 | $50,000 | $273,520 |
| 2022 | $10,822 | $299,560 | $42,000 | $257,560 |
| 2021 | $9,657 | $261,200 | $35,520 | $225,680 |
| 2020 | $9,716 | $261,200 | $35,520 | $225,680 |
| 2019 | $8,833 | $246,320 | $30,000 | $216,320 |
| 2018 | $8,865 | $246,320 | $30,000 | $216,320 |
| 2016 | $7,795 | $216,920 | $24,000 | $192,920 |
| 2015 | $7,893 | $216,920 | $24,000 | $192,920 |
| 2014 | -- | $216,920 | $24,000 | $192,920 |
Source: Public Records
Map
Nearby Homes
- 5465 Fort Fisher Way
- 5465 Fort Fisher Way
- 4531 Outer Bank Dr
- 5545 Fitzpatrick Terrace
- 5863 Revington Dr
- 5397 Valley Mist Ct
- 9005 Old Southwick Pass
- 5221 W Jones Bridge Rd
- 5354 Fox Hill Dr
- 5350 Wickershire Dr
- 955 Tiverton Ln
- 510 Covington Cove
- 5692 Broad River View Unit 435
- 5692 Broad River View
- 0 Old Southwick Pass Unit 10646630
- 0 Old Southwick Pass Unit 7683754
- 1285 Stuart Ridge
- 1055 Leadenhall St
- 9295 Chandler Bluff
- 5040 Harrington Rd
- 5575 Fort Fisher Way
- 5555 Fort Fisher Way
- 5585 Fort Fisher Way
- 5506 Southport Close
- 5545 Fort Fisher Way Unit 1
- 5554 Fort Fisher Way
- 5544 Fort Fisher Way
- 4614 Cape Kure Ct Unit 1
- 5574 Fort Fisher Way
- 5595 Fort Fisher Way
- 5497 Southport Close
- 0 Fort Fisher Way Unit 8864005
- 0 Fort Fisher Way Unit 8764146
- 0 Fort Fisher Way Unit 8121702
- 5496 Southport Close Unit 1
- 5584 Fort Fisher Way
- 4604 Cape Kure Ct
- 5535 Fort Fisher Way
- 5534 Fort Fisher Way Unit 1
- 4583 Cape Kure Ct