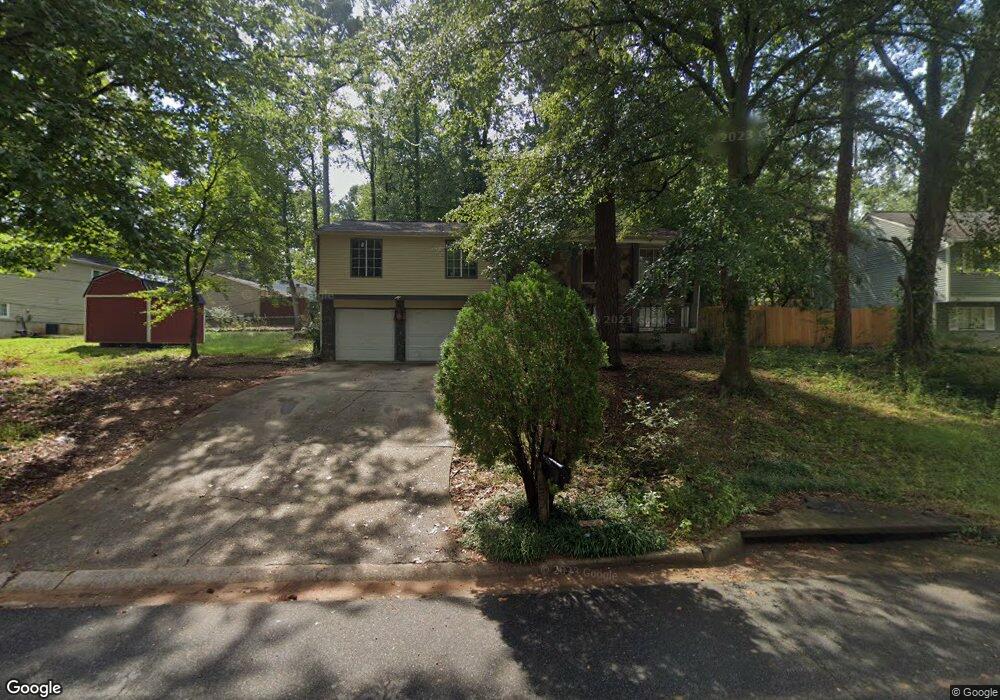
5566 Caesars Way Norcross, GA 30093
Estimated Value: $302,000 - $345,000
5
Beds
3
Baths
1,994
Sq Ft
$162/Sq Ft
Est. Value
About This Home
This home is located at 5566 Caesars Way, Norcross, GA 30093 and is currently estimated at $323,281, approximately $162 per square foot. 5566 Caesars Way is a home located in Gwinnett County with nearby schools including Meadowcreek Elementary School, Louise Radloff Middle School, and Meadowcreek High School.
Ownership History
Date
Name
Owned For
Owner Type
Purchase Details
Closed on
Aug 13, 2018
Sold by
Guo Lisa Qing
Bought by
Ramya Lakkaniga Vasuki
Current Estimated Value
Purchase Details
Closed on
Jan 10, 2018
Sold by
Guo Peng
Bought by
Guo Lisa Qing and Guo Michael Peng First Michael Peng First
Purchase Details
Closed on
Jan 20, 2006
Sold by
National Cty Bk Of In
Bought by
Hu Qiunping
Purchase Details
Closed on
Sep 22, 2000
Sold by
Hernandez Antonio B
Bought by
Hernandez Antonio R and Hernandez Isreal
Home Financials for this Owner
Home Financials are based on the most recent Mortgage that was taken out on this home.
Original Mortgage
$128,838
Interest Rate
7.97%
Mortgage Type
FHA
Purchase Details
Closed on
Oct 27, 1994
Sold by
Paucar Sonia M
Bought by
Tran Liet T and Vo Lan Thanh
Home Financials for this Owner
Home Financials are based on the most recent Mortgage that was taken out on this home.
Original Mortgage
$78,850
Interest Rate
8.68%
Create a Home Valuation Report for This Property
The Home Valuation Report is an in-depth analysis detailing your home's value as well as a comparison with similar homes in the area
Home Values in the Area
Average Home Value in this Area
Purchase History
| Date | Buyer | Sale Price | Title Company |
|---|---|---|---|
| Ramya Lakkaniga Vasuki | $150,000 | -- | |
| Guo Lisa Qing | -- | -- | |
| Hu Qiunping | $91,200 | -- | |
| Hernandez Antonio R | -- | -- | |
| Hernandez Antonio B | $129,900 | -- | |
| Tran Liet T | $83,000 | -- |
Source: Public Records
Mortgage History
| Date | Status | Borrower | Loan Amount |
|---|---|---|---|
| Previous Owner | Hernandez Antonio B | $128,838 | |
| Previous Owner | Tran Liet T | $78,850 |
Source: Public Records
Tax History Compared to Growth
Tax History
| Year | Tax Paid | Tax Assessment Tax Assessment Total Assessment is a certain percentage of the fair market value that is determined by local assessors to be the total taxable value of land and additions on the property. | Land | Improvement |
|---|---|---|---|---|
| 2025 | $5,243 | $140,480 | $21,120 | $119,360 |
| 2024 | $4,589 | $120,400 | $21,120 | $99,280 |
| 2023 | $4,589 | $115,360 | $24,800 | $90,560 |
| 2022 | $0 | $99,600 | $22,400 | $77,200 |
| 2021 | $2,936 | $73,720 | $16,000 | $57,720 |
| 2020 | $2,952 | $73,720 | $16,000 | $57,720 |
| 2019 | $2,348 | $59,440 | $13,600 | $45,840 |
| 2018 | $2,527 | $64,600 | $13,600 | $51,000 |
| 2016 | $1,656 | $39,240 | $10,400 | $28,840 |
| 2015 | $1,676 | $39,240 | $8,000 | $31,240 |
| 2014 | -- | $39,240 | $8,000 | $31,240 |
Source: Public Records
Map
Nearby Homes
- 5590 Stonewood Ct
- 1437 Roman Point Dr
- 1637 Roman Point Dr
- 1353 Harbins Ridge Dr Unit 36
- 897 Six Oaks Cir Unit B
- 1461 Silver Lake Dr
- 936 Six Oaks Cir Unit B
- 5719 Singlebriar Ct
- 5665 Terremont Cir
- 5605 Rock Place Ct
- 1413 Silver Lake Dr
- 5341 Woodbin Dr
- 1013 Sandune Dr
- 5554 Clover Rise Ln Unit 2
- 1133 Sandune Dr
- 5431 Village Green Square Unit 1018
- 5425 Village Green Square Unit 3
- 5576 Caesars Way Unit 5
- 85000 Caesars
- 1454 Wing Foot Way Unit 4
- 1444 Wing Foot Way
- 5541 Dove Trace
- 5586 Caesars Way
- 5551 Dove Trace Unit 4
- 0 Caesars Way Unit 3164913
- 0 Caesars Way Unit 8894275
- 0 Caesars Way
- 5565 Caesars Way Unit 5
- 1471 White Wing Ct Unit 5
- 1434 Wing Foot Way
- 5561 Dove Trace
- 1474 Wing Foot Way
- 5596 Caesars Way
- 5571 Dove Trace
- 1475 White Wing Ct Unit 5
- 1453 Wing Foot Way
- 1443 Wing Foot Way Unit 1443