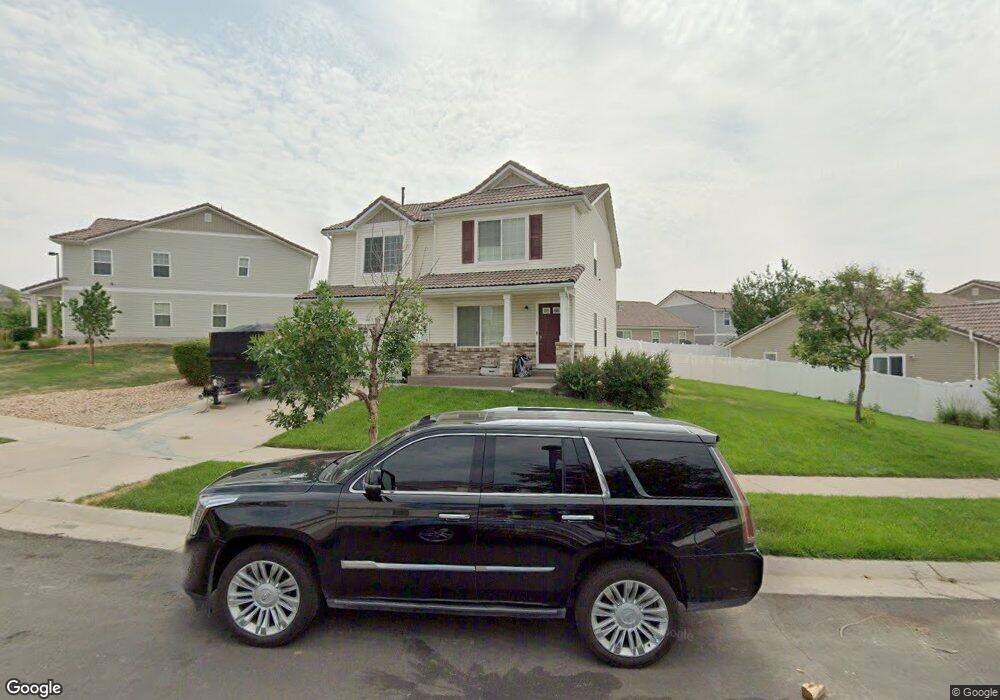
5568 Halifax Ct Denver, CO 80249
Green Valley Ranch NeighborhoodEstimated Value: $557,652 - $606,000
3
Beds
3
Baths
2,566
Sq Ft
$224/Sq Ft
Est. Value
About This Home
This home is located at 5568 Halifax Ct, Denver, CO 80249 and is currently estimated at $574,663, approximately $223 per square foot. 5568 Halifax Ct is a home located in Denver County with nearby schools including Pitt-Waller K-8 School, McGlone Academy, and Marie L. Greenwood Academy.
Ownership History
Date
Name
Owned For
Owner Type
Purchase Details
Closed on
Nov 29, 2021
Sold by
Deluna Jose Luis Mota and Barron Beatriz
Bought by
Mon Ong Tama and Sorn Kha Moon
Current Estimated Value
Home Financials for this Owner
Home Financials are based on the most recent Mortgage that was taken out on this home.
Original Mortgage
$522,500
Outstanding Balance
$480,434
Interest Rate
3.09%
Mortgage Type
New Conventional
Estimated Equity
$94,229
Purchase Details
Closed on
Aug 24, 2018
Sold by
Gaeta Antonio J
Bought by
Luna Jose Luis Mota De and Barron Beatriz
Home Financials for this Owner
Home Financials are based on the most recent Mortgage that was taken out on this home.
Original Mortgage
$379,499
Interest Rate
4.75%
Mortgage Type
FHA
Purchase Details
Closed on
Sep 26, 2006
Sold by
Oakwood Homes Llc
Bought by
Gaeta Antonio J
Home Financials for this Owner
Home Financials are based on the most recent Mortgage that was taken out on this home.
Original Mortgage
$196,000
Interest Rate
6.47%
Mortgage Type
New Conventional
Create a Home Valuation Report for This Property
The Home Valuation Report is an in-depth analysis detailing your home's value as well as a comparison with similar homes in the area
Home Values in the Area
Average Home Value in this Area
Purchase History
| Date | Buyer | Sale Price | Title Company |
|---|---|---|---|
| Mon Ong Tama | $550,000 | Land Title Guarantee Company | |
| Luna Jose Luis Mota De | $386,500 | Chicago Title | |
| Gaeta Antonio J | $245,000 | Town & Country Title Service |
Source: Public Records
Mortgage History
| Date | Status | Borrower | Loan Amount |
|---|---|---|---|
| Open | Mon Ong Tama | $522,500 | |
| Previous Owner | Luna Jose Luis Mota De | $379,499 | |
| Previous Owner | Gaeta Antonio J | $196,000 |
Source: Public Records
Tax History Compared to Growth
Tax History
| Year | Tax Paid | Tax Assessment Tax Assessment Total Assessment is a certain percentage of the fair market value that is determined by local assessors to be the total taxable value of land and additions on the property. | Land | Improvement |
|---|---|---|---|---|
| 2024 | $4,615 | $36,070 | $3,050 | $33,020 |
| 2023 | $4,442 | $36,070 | $3,050 | $33,020 |
| 2022 | $3,903 | $29,320 | $6,050 | $23,270 |
| 2021 | $3,903 | $30,170 | $6,230 | $23,940 |
| 2020 | $3,594 | $27,120 | $6,230 | $20,890 |
| 2019 | $3,537 | $27,120 | $6,230 | $20,890 |
| 2018 | $3,250 | $24,000 | $3,860 | $20,140 |
| 2017 | $4,032 | $24,000 | $3,860 | $20,140 |
| 2016 | $3,397 | $20,520 | $3,733 | $16,787 |
| 2015 | $3,327 | $20,520 | $3,733 | $16,787 |
| 2014 | $2,248 | $14,220 | $2,388 | $11,832 |
Source: Public Records
Map
Nearby Homes
- 5564 Gibraltar St
- 5555 Himalaya Rd
- 20108 Randolph Place
- 5559 Gibraltar St
- 20109 Randolph Place
- 20194 Robins Dr
- 5714 N Gibralter Way Unit 102
- 5714 N Gibralter Way Unit 5204
- 5520 Genoa St
- 5723 N Gibralter Way Unit 4201
- 5519 Genoa St
- 5694 N Gibralter Way Unit 108
- 5538 Espana Ct
- 20162 E 53rd Place
- 19753 E 54th Ave
- 24374 E 42nd Ave
- 5705 N Genoa Way Unit 206
- 5763 N Gibralter Way Unit 2-203
- 19517 E 55th Ave
- 5756 N Genoa Way Unit 12-205
- 20058 Randolph Place
- 5566 Halifax Ct
- 5569 Himalaya Rd
- 20078 Randolph Place
- 5567 N Himalaya Rd
- 5567 Himalaya Rd
- 5562 Halifax Ct
- 20037 March Dr
- 5569 Halifax Ct
- 5565 Himalaya Rd
- 5571 Halifax Ct
- 20059 Randolph Place
- 20069 Randolph Place
- 5560 Halifax Ct
- 20027 March Dr
- 20079 Randolph Place
- 5563 Himalaya Rd
- 20089 Randolph Place
- 20036 March Dr
- 20099 Randolph Place