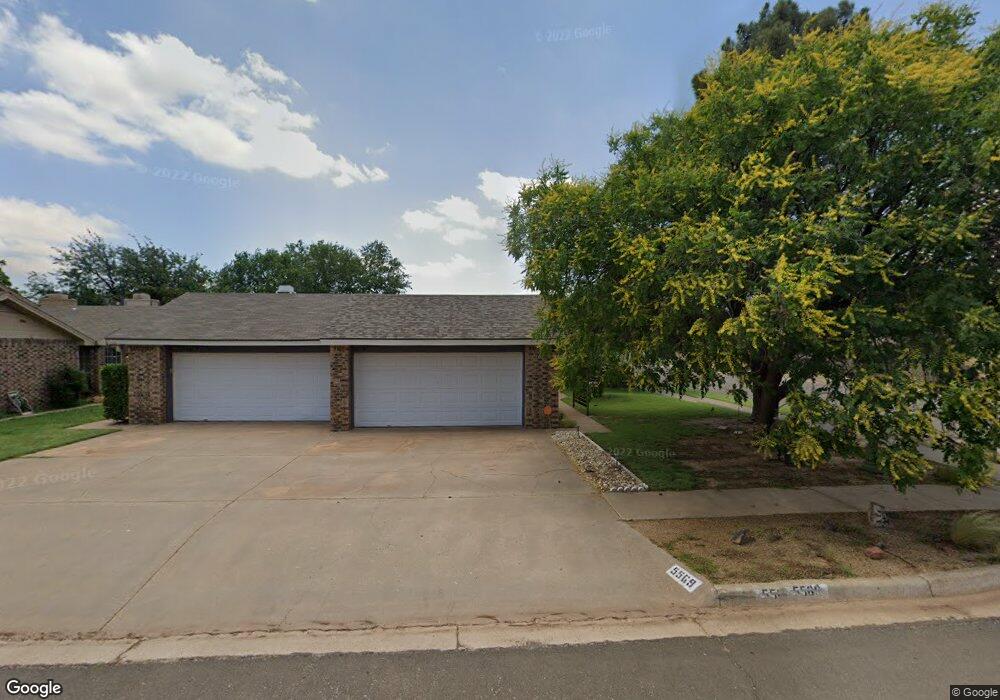
5569 93rd St Lubbock, TX 79424
Preston Smith NeighborhoodEstimated Value: $176,000 - $190,000
3
Beds
2
Baths
1,370
Sq Ft
$135/Sq Ft
Est. Value
About This Home
This home is located at 5569 93rd St, Lubbock, TX 79424 and is currently estimated at $184,517, approximately $134 per square foot. 5569 93rd St is a home located in Lubbock County with nearby schools including Smith Elementary School, Irons Middle School, and Coronado High School.
Ownership History
Date
Name
Owned For
Owner Type
Purchase Details
Closed on
Feb 27, 2018
Sold by
Penner Christopher and Penner Tina
Bought by
Sain Cheri and Sain John
Current Estimated Value
Home Financials for this Owner
Home Financials are based on the most recent Mortgage that was taken out on this home.
Original Mortgage
$97,273
Outstanding Balance
$83,411
Interest Rate
4.5%
Mortgage Type
FHA
Estimated Equity
$101,106
Purchase Details
Closed on
Sep 17, 2009
Sold by
Southwest Meadowglen Townhomes Llc
Bought by
Penner Christopher and Penner Tina
Create a Home Valuation Report for This Property
The Home Valuation Report is an in-depth analysis detailing your home's value as well as a comparison with similar homes in the area
Home Values in the Area
Average Home Value in this Area
Purchase History
| Date | Buyer | Sale Price | Title Company |
|---|---|---|---|
| Sain Cheri | -- | Hub City Title | |
| Penner Christopher | -- | -- |
Source: Public Records
Mortgage History
| Date | Status | Borrower | Loan Amount |
|---|---|---|---|
| Open | Sain Cheri | $97,273 |
Source: Public Records
Tax History Compared to Growth
Tax History
| Year | Tax Paid | Tax Assessment Tax Assessment Total Assessment is a certain percentage of the fair market value that is determined by local assessors to be the total taxable value of land and additions on the property. | Land | Improvement |
|---|---|---|---|---|
| 2025 | $1,967 | $162,657 | $10,350 | $152,307 |
| 2024 | $1,967 | $158,331 | $10,350 | $147,981 |
| 2023 | $2,687 | $144,542 | $10,350 | $134,192 |
| 2022 | $2,660 | $131,402 | $10,350 | $154,903 |
| 2021 | $2,558 | $119,456 | $10,350 | $109,106 |
| 2020 | $2,598 | $119,456 | $10,350 | $109,106 |
| 2019 | $2,682 | $119,456 | $10,350 | $109,106 |
| 2018 | $2,262 | $100,645 | $10,350 | $90,295 |
| 2017 | $2,265 | $100,645 | $10,350 | $90,295 |
| 2016 | $1,887 | $83,851 | $10,350 | $73,501 |
| 2015 | $1,356 | $76,228 | $6,900 | $69,328 |
| 2014 | $1,356 | $69,298 | $6,900 | $62,398 |
Source: Public Records
Map
Nearby Homes