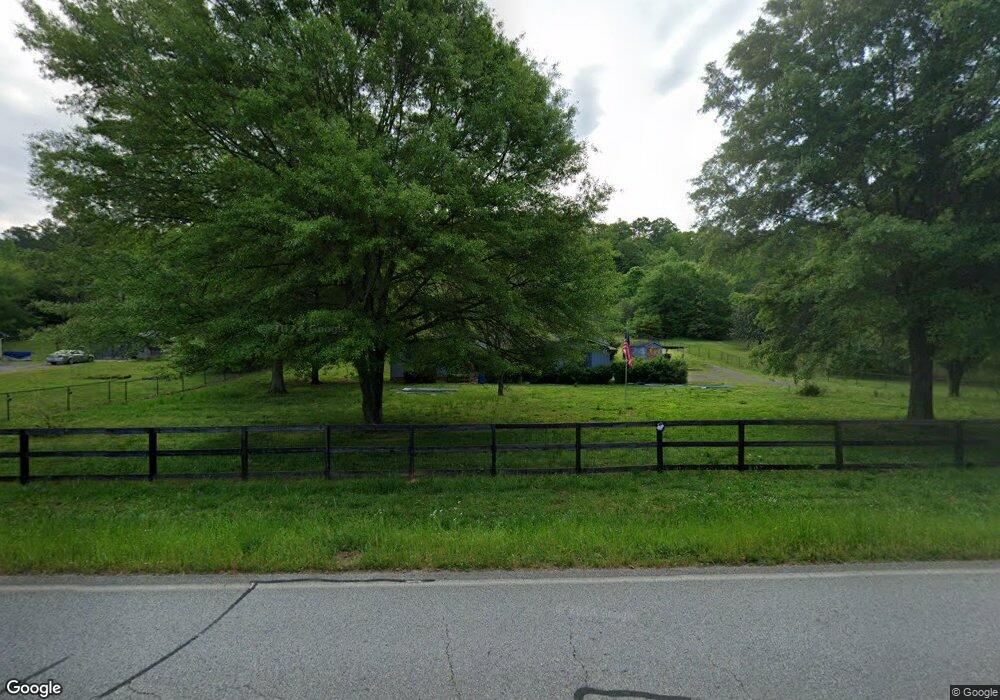
5569 Fosters Mill Rd SW Cave Spring, GA 30124
Estimated Value: $174,000 - $242,000
3
Beds
2
Baths
1,847
Sq Ft
$117/Sq Ft
Est. Value
About This Home
This home is located at 5569 Fosters Mill Rd SW, Cave Spring, GA 30124 and is currently estimated at $216,203, approximately $117 per square foot. 5569 Fosters Mill Rd SW is a home located in Floyd County with nearby schools including Coosa Middle School and Coosa High School.
Ownership History
Date
Name
Owned For
Owner Type
Purchase Details
Closed on
Sep 14, 2022
Sold by
Godfrey Kenneth Lamar Estate
Bought by
Godfrey Kenneth Lance
Current Estimated Value
Purchase Details
Closed on
Mar 28, 2013
Sold by
Godfrey Kenneth Lamar
Bought by
P and R
Purchase Details
Closed on
Aug 14, 2003
Bought by
P and R
Purchase Details
Closed on
May 30, 2003
Sold by
Godfrey Kenneth Lamar and Godfrey Glenda
Bought by
Godfrey Kenneth Lamar
Purchase Details
Closed on
May 18, 1978
Sold by
Odom Bruce M and Odom Amy F
Bought by
Godfrey Kenneth Lamar and Godfrey Glenda
Purchase Details
Closed on
Oct 10, 1975
Sold by
Morgan B J
Bought by
Odom Bruce M and Odom Amy F
Purchase Details
Closed on
Apr 1, 1972
Sold by
Cline Horace L and Cline Lindsey D
Bought by
Morgan B J
Purchase Details
Closed on
Jul 15, 1965
Bought by
Cline Horace L and Cline Lindsey D
Create a Home Valuation Report for This Property
The Home Valuation Report is an in-depth analysis detailing your home's value as well as a comparison with similar homes in the area
Home Values in the Area
Average Home Value in this Area
Purchase History
| Date | Buyer | Sale Price | Title Company |
|---|---|---|---|
| Godfrey Kenneth Lance | -- | -- | |
| P | -- | -- | |
| P | -- | -- | |
| Godfrey Kenneth Lamar | -- | -- | |
| Godfrey Kenneth Lamar | $42,400 | -- | |
| Odom Bruce M | $5,000 | -- | |
| Morgan B J | $2,000 | -- | |
| Cline Horace L | -- | -- |
Source: Public Records
Tax History Compared to Growth
Tax History
| Year | Tax Paid | Tax Assessment Tax Assessment Total Assessment is a certain percentage of the fair market value that is determined by local assessors to be the total taxable value of land and additions on the property. | Land | Improvement |
|---|---|---|---|---|
| 2024 | $1,713 | $62,045 | $6,984 | $55,061 |
| 2023 | $1,632 | $62,593 | $6,984 | $55,609 |
| 2022 | $1,506 | $55,052 | $6,984 | $48,068 |
| 2021 | $1,424 | $51,086 | $6,984 | $44,102 |
| 2020 | $1,377 | $49,651 | $6,984 | $42,667 |
| 2019 | $1,334 | $48,109 | $6,984 | $41,125 |
| 2018 | $1,299 | $46,762 | $6,984 | $39,778 |
| 2017 | $394 | $46,032 | $6,984 | $39,048 |
| 2016 | $340 | $43,304 | $6,984 | $36,320 |
| 2015 | $991 | $43,904 | $6,984 | $36,920 |
| 2014 | $991 | $44,464 | $6,984 | $37,480 |
Source: Public Records
Map
Nearby Homes
- 5598 Fosters Mill Rd
- 5677 Fosters Mill Rd SW
- 57 Mill St
- 104 Fincher St
- 22 River St SW
- 7 Herschel Mize Dr SW
- 7 Herschel Mize Dr
- 0 Mill Rd Unit 10629874
- 0 Mill Rd Unit 7670319
- 0 Melson Rd SW Unit 7676052
- 0 Melson Rd SW Unit 10636997
- 8876 Cave Spring Rd SW
- 8876 Cave Spring
- 10 Ridge Rd SW
- 907 Gadsden Rd SW
- 0 McGee Bend Rd SW Unit 10351960
- 2053 Buttermilk Rd SW
- 424 Michael Blvd
- 383 Valley Grove Rd
- 100 Lee Ave
- 5605 Fosters Mill Rd SW
- 5595 Fosters Mill Rd SW
- 5576 Fosters Mill Rd SW
- 5558 Fosters Mill Rd SW
- 5533 Fosters Mill Rd SW
- 5544 Fosters Mill Rd SW
- 5606 Fosters Mill Rd SW
- 5530 Fosters Mill Rd SW
- 5629 Fosters Mill Rd SW
- 5511 Fosters Mill Rd SW
- 5639 Fosters Mill Rd SW
- 5497 Fosters Mill Rd SW
- 5646 Fosters Mill Rd SW
- 5657 Fosters Mill Rd SW
- 5477 Fosters Mill Rd SW
- 5472 Fosters Mill Rd SW
- 5670 Fosters Mill Rd SW
- 5670 Fosters Mill Rd SW
- 5455 Fosters Mill Rd SW
- 5697 Fosters Mill Rd SW