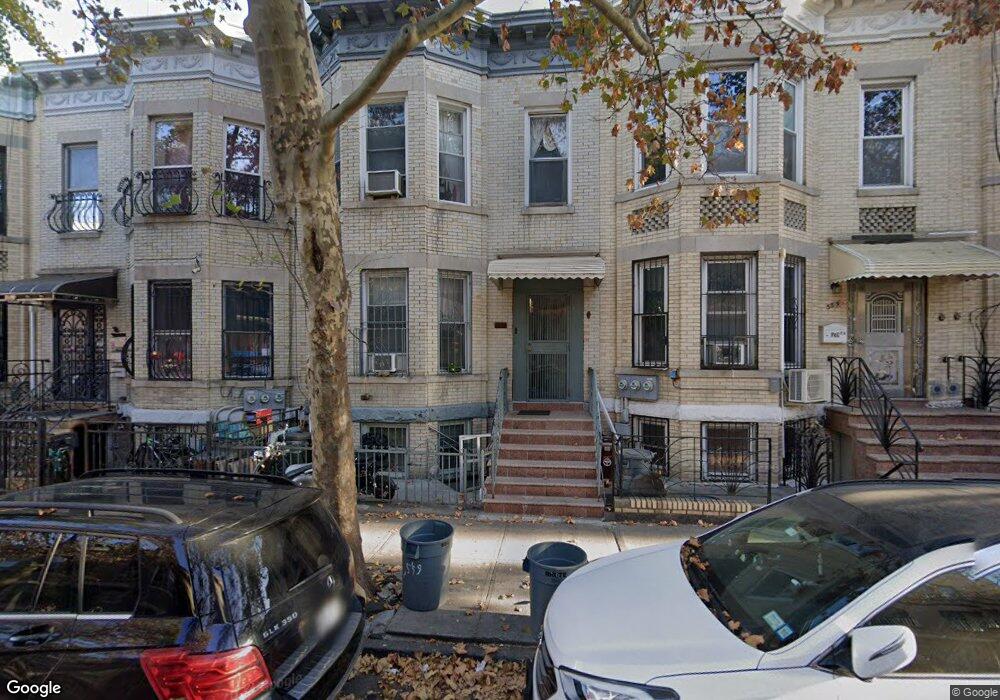
557 57th St Brooklyn, NY 11220
Sunset Park NeighborhoodEstimated Value: $1,141,792 - $1,513,000
--
Bed
--
Bath
2,048
Sq Ft
$689/Sq Ft
Est. Value
About This Home
This home is located at 557 57th St, Brooklyn, NY 11220 and is currently estimated at $1,410,198, approximately $688 per square foot. 557 57th St is a home located in Kings County with nearby schools including P.S. 503: The School of Discovery, IS 220 John J. Pershing, and Fort Hamilton High School.
Ownership History
Date
Name
Owned For
Owner Type
Purchase Details
Closed on
Jun 6, 2003
Sold by
Chan Hoi Fai and Wong Choi Fung
Bought by
Cheung Chin Yung and Jiang Yu Qin
Current Estimated Value
Purchase Details
Closed on
Jul 23, 1997
Sold by
Wong Choi Fung Wu
Bought by
Wong Choi Fung Wu and Chan Hoi Fai
Create a Home Valuation Report for This Property
The Home Valuation Report is an in-depth analysis detailing your home's value as well as a comparison with similar homes in the area
Home Values in the Area
Average Home Value in this Area
Purchase History
| Date | Buyer | Sale Price | Title Company |
|---|---|---|---|
| Cheung Chin Yung | $480,000 | -- | |
| Cheung Chin Yung | $480,000 | -- | |
| Wong Choi Fung Wu | $55,000 | First American Title Ins Co | |
| Wong Choi Fung Wu | -- | First American Title Ins Co |
Source: Public Records
Mortgage History
| Date | Status | Borrower | Loan Amount |
|---|---|---|---|
| Closed | Cheung Chin Yung | $0 |
Source: Public Records
Tax History Compared to Growth
Tax History
| Year | Tax Paid | Tax Assessment Tax Assessment Total Assessment is a certain percentage of the fair market value that is determined by local assessors to be the total taxable value of land and additions on the property. | Land | Improvement |
|---|---|---|---|---|
| 2025 | $7,289 | $66,600 | $21,900 | $44,700 |
| 2024 | $7,289 | $64,860 | $21,900 | $42,960 |
| 2023 | $6,941 | $77,880 | $21,900 | $55,980 |
| 2022 | $6,414 | $64,980 | $21,900 | $43,080 |
| 2021 | $6,369 | $58,020 | $21,900 | $36,120 |
| 2020 | $3,163 | $70,380 | $21,900 | $48,480 |
| 2019 | $6,277 | $57,900 | $21,900 | $36,000 |
| 2018 | $5,746 | $29,647 | $9,937 | $19,710 |
| 2017 | $5,403 | $27,974 | $10,345 | $17,629 |
| 2016 | $4,966 | $26,391 | $9,740 | $16,651 |
| 2015 | $2,963 | $26,374 | $11,080 | $15,294 |
| 2014 | $2,963 | $26,174 | $12,590 | $13,584 |
Source: Public Records
Map
Nearby Homes