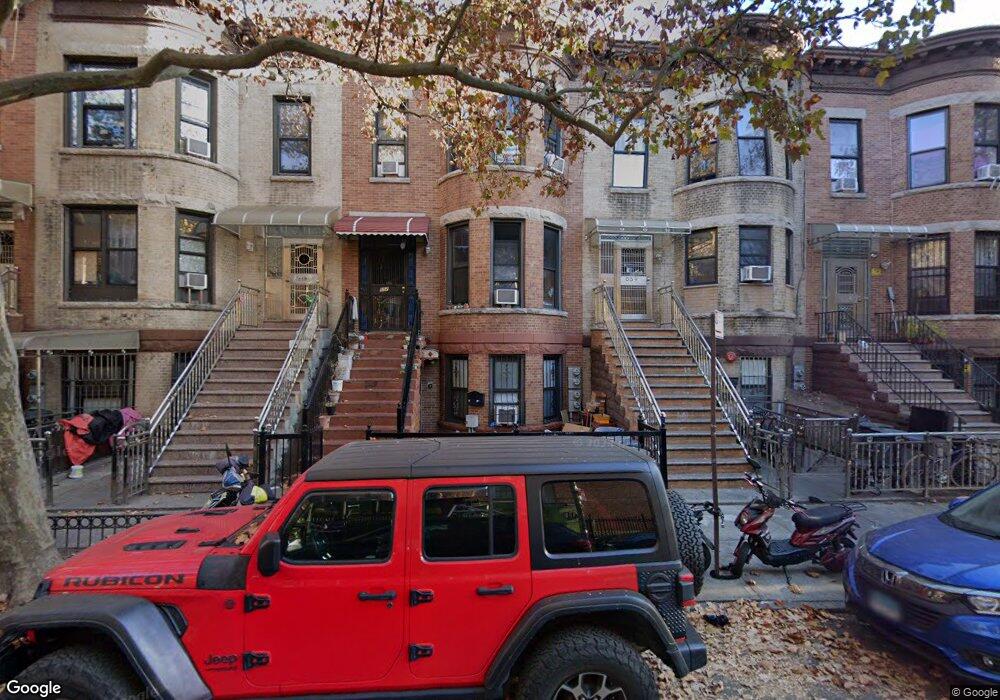
557 59th St Brooklyn, NY 11220
Sunset Park NeighborhoodEstimated Value: $1,592,000 - $1,880,933
--
Bed
--
Bath
3,120
Sq Ft
$553/Sq Ft
Est. Value
About This Home
This home is located at 557 59th St, Brooklyn, NY 11220 and is currently estimated at $1,723,983, approximately $552 per square foot. 557 59th St is a home located in Kings County with nearby schools including P.S. 506: The School of Journalism & Technology, IS 220 John J. Pershing, and Fort Hamilton High School.
Ownership History
Date
Name
Owned For
Owner Type
Purchase Details
Closed on
Nov 14, 2011
Sold by
Draheim Michael
Bought by
Ni Ming Zhen and Ni Ziao Ping
Current Estimated Value
Home Financials for this Owner
Home Financials are based on the most recent Mortgage that was taken out on this home.
Original Mortgage
$490,000
Outstanding Balance
$335,421
Interest Rate
4.1%
Mortgage Type
Purchase Money Mortgage
Estimated Equity
$1,388,562
Purchase Details
Closed on
Dec 10, 2001
Sold by
Draheim Michael
Bought by
Draheim Thomas and Draheim Michael
Create a Home Valuation Report for This Property
The Home Valuation Report is an in-depth analysis detailing your home's value as well as a comparison with similar homes in the area
Home Values in the Area
Average Home Value in this Area
Purchase History
| Date | Buyer | Sale Price | Title Company |
|---|---|---|---|
| Ni Ming Zhen | $975,000 | -- | |
| Draheim Thomas | -- | -- |
Source: Public Records
Mortgage History
| Date | Status | Borrower | Loan Amount |
|---|---|---|---|
| Open | Ni Ming Zhen | $490,000 |
Source: Public Records
Tax History Compared to Growth
Tax History
| Year | Tax Paid | Tax Assessment Tax Assessment Total Assessment is a certain percentage of the fair market value that is determined by local assessors to be the total taxable value of land and additions on the property. | Land | Improvement |
|---|---|---|---|---|
| 2025 | $9,510 | $95,100 | $30,900 | $64,200 |
| 2024 | $9,510 | $91,740 | $30,900 | $60,840 |
| 2023 | $9,129 | $98,820 | $30,900 | $67,920 |
| 2022 | $8,966 | $87,240 | $30,900 | $56,340 |
| 2021 | $9,310 | $87,480 | $30,900 | $56,580 |
| 2020 | $4,357 | $88,740 | $30,900 | $57,840 |
| 2019 | $8,205 | $84,180 | $30,900 | $53,280 |
| 2018 | $7,576 | $38,627 | $19,755 | $18,872 |
| 2017 | $7,574 | $38,627 | $18,385 | $20,242 |
| 2016 | $7,361 | $38,371 | $17,739 | $20,632 |
| 2015 | $3,574 | $36,500 | $21,046 | $15,454 |
| 2014 | $3,574 | $29,450 | $16,795 | $12,655 |
Source: Public Records
Map
Nearby Homes