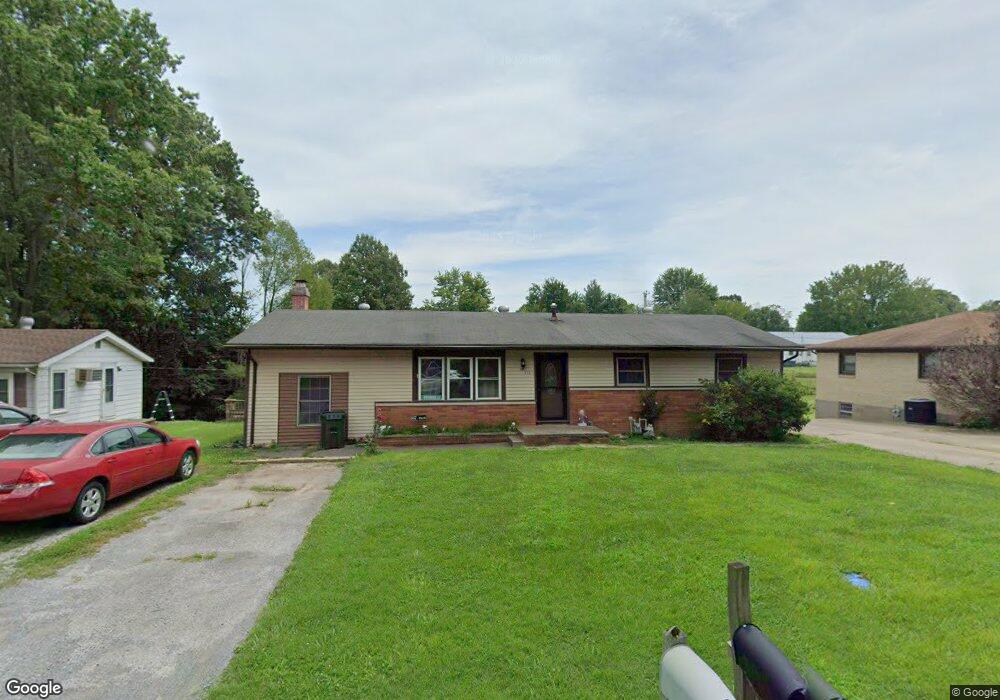
557 Elm St Calvert City, KY 42029
Estimated Value: $102,420 - $168,000
3
Beds
2
Baths
1,624
Sq Ft
$87/Sq Ft
Est. Value
About This Home
This home is located at 557 Elm St, Calvert City, KY 42029 and is currently estimated at $141,355, approximately $87 per square foot. 557 Elm St is a home located in Marshall County with nearby schools including Calvert City Elementary School, North Marshall Middle School, and Marshall County High School.
Ownership History
Date
Name
Owned For
Owner Type
Purchase Details
Closed on
Sep 6, 2011
Sold by
Watson Delbert
Bought by
Watson Rhonda
Current Estimated Value
Purchase Details
Closed on
Jun 2, 2006
Sold by
Fern Carolyn
Bought by
Watson Delbert and Watson Rhonda
Home Financials for this Owner
Home Financials are based on the most recent Mortgage that was taken out on this home.
Original Mortgage
$30,489
Interest Rate
6.5%
Mortgage Type
Purchase Money Mortgage
Purchase Details
Closed on
Nov 4, 2005
Sold by
Estate Of James L Fern
Bought by
Fern Carolyn
Create a Home Valuation Report for This Property
The Home Valuation Report is an in-depth analysis detailing your home's value as well as a comparison with similar homes in the area
Home Values in the Area
Average Home Value in this Area
Purchase History
| Date | Buyer | Sale Price | Title Company |
|---|---|---|---|
| Watson Rhonda | -- | None Available | |
| Watson Delbert | $36,600 | None Available | |
| Fern Carolyn | -- | None Available |
Source: Public Records
Mortgage History
| Date | Status | Borrower | Loan Amount |
|---|---|---|---|
| Closed | Watson Delbert | $30,489 |
Source: Public Records
Tax History Compared to Growth
Tax History
| Year | Tax Paid | Tax Assessment Tax Assessment Total Assessment is a certain percentage of the fair market value that is determined by local assessors to be the total taxable value of land and additions on the property. | Land | Improvement |
|---|---|---|---|---|
| 2024 | $566 | $68,000 | $8,000 | $60,000 |
| 2023 | $588 | $68,000 | $8,000 | $60,000 |
| 2022 | $613 | $68,000 | $8,000 | $60,000 |
| 2021 | $501 | $55,000 | $8,000 | $47,000 |
| 2020 | $505 | $55,000 | $8,000 | $47,000 |
| 2019 | $504 | $55,000 | $8,000 | $47,000 |
| 2018 | $506 | $55,000 | $8,000 | $47,000 |
| 2017 | $506 | $55,000 | $8,000 | $47,000 |
| 2016 | $469 | $51,000 | $6,000 | $45,000 |
| 2015 | $472 | $51,000 | $6,000 | $45,000 |
| 2014 | $471 | $51,000 | $0 | $0 |
| 2010 | -- | $51,000 | $6,000 | $45,000 |
Source: Public Records
Map
Nearby Homes
- 718 Elder St
- 680 Chestnut St
- 00 Pine St
- 271 E 3rd Ave
- 565 S Main St
- 0000 Industrial Pkwy
- 808 Oak Park Blvd
- 59 Aspen St
- 188 Magnolia St
- 43 2nd Ave SE
- 106 3rd Ave SW
- 300 Princess Jennifer Dr
- Lot 7 Edison Dr
- 359 Ironwood Dr
- 000 Quail Rd Unit Oaklawn Lane
- 4300 U S 62
- 300 Scillion Dr
- 000 Lone Valley Rd
- Lot 25 Ford Square Dr
- Lot 24 Ford Square Dr