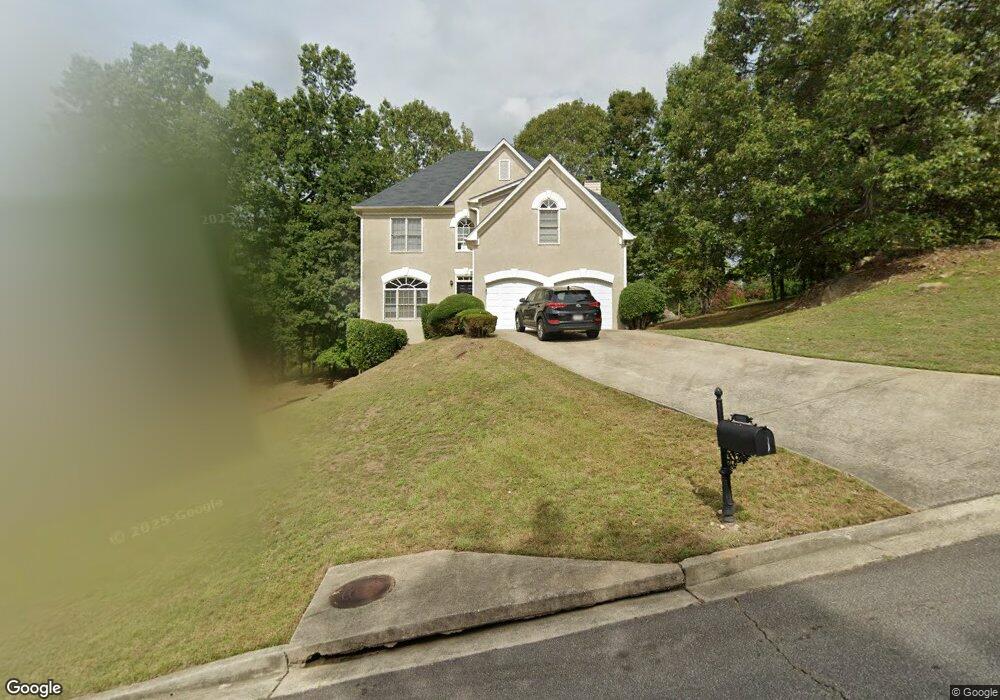
557 Ivey Way SE Unit 61 Mableton, GA 30126
Estimated Value: $356,902 - $434,000
4
Beds
3
Baths
2,114
Sq Ft
$181/Sq Ft
Est. Value
About This Home
This home is located at 557 Ivey Way SE Unit 61, Mableton, GA 30126 and is currently estimated at $383,476, approximately $181 per square foot. 557 Ivey Way SE Unit 61 is a home located in Cobb County with nearby schools including Clay-Harmony Leland Elementary School, Lindley Middle School, and Pebblebrook High School.
Ownership History
Date
Name
Owned For
Owner Type
Purchase Details
Closed on
Jun 18, 2020
Sold by
Us Sfe Asset Company 3 Llc
Bought by
Baf Assets Llc
Current Estimated Value
Purchase Details
Closed on
Feb 19, 2016
Sold by
Eph 2 Assets Llc
Bought by
Us Sef Asset Co 3 Llc
Purchase Details
Closed on
Feb 4, 2015
Sold by
Turner Tawaine
Bought by
Eph 2 Assets Llc
Purchase Details
Closed on
May 28, 1998
Sold by
Richardson Kenneth J
Bought by
Turner Tawaina
Home Financials for this Owner
Home Financials are based on the most recent Mortgage that was taken out on this home.
Original Mortgage
$123,500
Interest Rate
7.15%
Mortgage Type
New Conventional
Purchase Details
Closed on
Sep 28, 1993
Sold by
Macauley Props Ltd
Bought by
Richardson Kenneth J
Home Financials for this Owner
Home Financials are based on the most recent Mortgage that was taken out on this home.
Original Mortgage
$117,158
Interest Rate
7%
Mortgage Type
VA
Create a Home Valuation Report for This Property
The Home Valuation Report is an in-depth analysis detailing your home's value as well as a comparison with similar homes in the area
Home Values in the Area
Average Home Value in this Area
Purchase History
| Date | Buyer | Sale Price | Title Company |
|---|---|---|---|
| Baf Assets Llc | $890,900 | Bchh Inc | |
| Us Sef Asset Co 3 Llc | -- | -- | |
| Eph 2 Assets Llc | $137,000 | -- | |
| Turner Tawaina | $130,000 | -- | |
| Richardson Kenneth J | $115,800 | -- |
Source: Public Records
Mortgage History
| Date | Status | Borrower | Loan Amount |
|---|---|---|---|
| Previous Owner | Turner Tawaina | $123,500 | |
| Previous Owner | Richardson Kenneth J | $117,158 |
Source: Public Records
Tax History Compared to Growth
Tax History
| Year | Tax Paid | Tax Assessment Tax Assessment Total Assessment is a certain percentage of the fair market value that is determined by local assessors to be the total taxable value of land and additions on the property. | Land | Improvement |
|---|---|---|---|---|
| 2024 | $3,693 | $122,492 | $20,000 | $102,492 |
| 2023 | $3,693 | $122,492 | $20,000 | $102,492 |
| 2022 | $3,142 | $103,520 | $14,000 | $89,520 |
| 2021 | $2,867 | $94,480 | $14,000 | $80,480 |
| 2020 | $2,447 | $80,616 | $14,000 | $66,616 |
| 2019 | $2,447 | $80,616 | $14,000 | $66,616 |
| 2018 | $1,663 | $54,780 | $9,620 | $45,160 |
| 2017 | $1,575 | $54,780 | $9,620 | $45,160 |
| 2016 | $1,575 | $54,780 | $9,620 | $45,160 |
| 2015 | $1,664 | $56,472 | $9,600 | $46,872 |
| 2014 | $1,241 | $41,772 | $0 | $0 |
Source: Public Records
Map
Nearby Homes
- 6604 Destiny Dr SE
- 540 Glen Abbey Cir SE
- 541 Glen Abbey Cir
- 598 Mount Gerizim Rd SE
- 6650 Queen Mill Rd SE
- 6424 Mountain Home Way SE
- 6528 Mountain Home Way SE
- 6533 Mountain Home Way SE
- 376 Hunnicutt Rd SE
- 760 King Sword Ct SE
- 378 Vinings Vintage Cir
- 261 Stroud Dr SE
- 6321 Mountain Home Way SE
- 6305 Mountain Home Way SE
- 458 Vinings Vintage Cir Unit 1
- 457 Vinings Vintage Cir
- 193 Clydesdale Ln SE
- 557 Ivey Way SE
- 555 Ivey Way SE
- 556 Ivey Way SE
- 476 Ivey Ct SE
- 553 Ivey Way SE
- 558 Ivey Way SE Unit 3
- 561 Ivey Way SE
- 0 Ivey Way SE Unit 7586205
- 0 Ivey Way SE Unit 7531476
- 0 Ivey Way SE Unit 8804845
- 0 Ivey Way SE Unit 7130826
- 0 Ivey Way SE Unit 7194946
- 0 Ivey Way SE Unit 7251166
- 0 Ivey Way SE Unit 7254834
- 0 Ivey Way SE
- 554 Ivey Way SE Unit Basement
- 554 Ivey Way SE
- 560 Ivey Way SE
- 475 Ivey Ct SE
- 551 Ivey Way SE