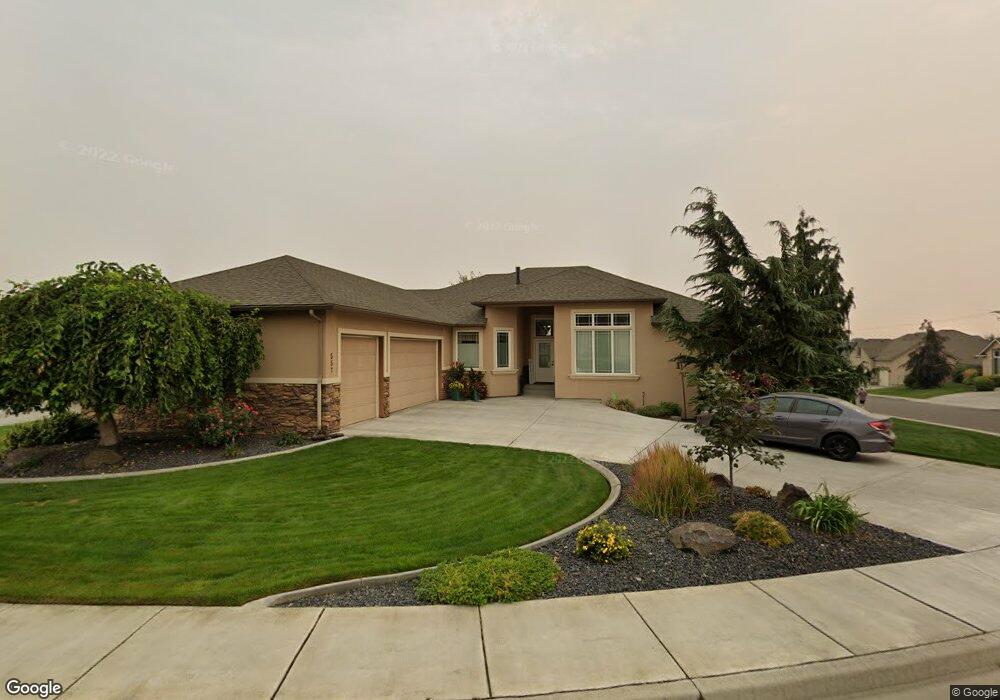
557 Lodi Loop Richland, WA 99352
Estimated Value: $672,070 - $738,000
4
Beds
4
Baths
2,466
Sq Ft
$285/Sq Ft
Est. Value
About This Home
This home is located at 557 Lodi Loop, Richland, WA 99352 and is currently estimated at $702,518, approximately $284 per square foot. 557 Lodi Loop is a home located in Benton County with nearby schools including Orchard Elementary School, Enterprise Middle School, and Richland High School.
Ownership History
Date
Name
Owned For
Owner Type
Purchase Details
Closed on
Apr 28, 2008
Sold by
B & B Construction Inc
Bought by
Beattie Troy A and Beattie Deanne
Current Estimated Value
Home Financials for this Owner
Home Financials are based on the most recent Mortgage that was taken out on this home.
Original Mortgage
$329,000
Outstanding Balance
$202,908
Interest Rate
5.81%
Mortgage Type
Purchase Money Mortgage
Estimated Equity
$499,610
Purchase Details
Closed on
Aug 7, 2007
Sold by
Jvz & Mvz Enterprises Llc
Bought by
B & B Construction Inc
Home Financials for this Owner
Home Financials are based on the most recent Mortgage that was taken out on this home.
Original Mortgage
$332,000
Interest Rate
6.74%
Mortgage Type
Construction
Create a Home Valuation Report for This Property
The Home Valuation Report is an in-depth analysis detailing your home's value as well as a comparison with similar homes in the area
Home Values in the Area
Average Home Value in this Area
Purchase History
| Date | Buyer | Sale Price | Title Company |
|---|---|---|---|
| Beattie Troy A | $429,000 | Benton Franklin Title Co | |
| B & B Construction Inc | $47,500 | Benton Franklin Titl |
Source: Public Records
Mortgage History
| Date | Status | Borrower | Loan Amount |
|---|---|---|---|
| Open | Beattie Troy A | $329,000 | |
| Previous Owner | B & B Construction Inc | $332,000 |
Source: Public Records
Tax History
| Year | Tax Paid | Tax Assessment Tax Assessment Total Assessment is a certain percentage of the fair market value that is determined by local assessors to be the total taxable value of land and additions on the property. | Land | Improvement |
|---|---|---|---|---|
| 2025 | $600 | $682,050 | $85,000 | $597,050 |
| 2024 | $6,036 | $664,990 | $85,000 | $579,990 |
| 2023 | $6,036 | $647,930 | $85,000 | $562,930 |
| 2022 | $5,645 | $579,700 | $85,000 | $494,700 |
| 2021 | $5,105 | $511,460 | $85,000 | $426,460 |
| 2020 | $6,061 | $443,230 | $85,000 | $358,230 |
| 2019 | $5,634 | $498,110 | $58,000 | $440,110 |
| 2018 | $5,746 | $498,110 | $58,000 | $440,110 |
| 2017 | $5,083 | $424,760 | $58,000 | $366,760 |
| 2016 | $5,449 | $424,760 | $58,000 | $366,760 |
| 2015 | $5,535 | $424,760 | $58,000 | $366,760 |
| 2014 | -- | $424,760 | $58,000 | $366,760 |
| 2013 | -- | $424,760 | $58,000 | $366,760 |
Source: Public Records
Map
Nearby Homes
- 586 Lodi Loop
- 1430 Purple Sage St
- 1418 Chardonnay Dr
- 1240 Vintage Ave
- 1269 Jubilee St
- 1359 White Bluffs St
- 654 Nastacia St
- 1133 Fairhaven Loop Unit 9
- 1101 Fairhaven Loop
- 1352 Westgate Way
- 1157 Fairhaven Loop Unit 15
- 1149 Fairhaven Loop Unit 13
- 1137 Fairhaven Loop Unit 10
- 1141 Fairhaven Loop Unit 11
- 1130 Fairhaven Loop Unit 27
- 1145 Fairhaven Loop Unit 12
- 1153 Fairhaven Loop Unit 14
- 1126 Fairhaven Loop Unit 28
- 1102 Fairhaven Loop Unit 34
- 1113 Fairhaven Loop Unit 4
- 535 Lodi Loop
- 576 Lodi Loop
- 523 Lodi Loop Unit Gorgeous Hardwood fl
- 523 Lodi Loop Unit INCREDIBLE "LOW MAIN
- 523 Lodi Loop
- 572 Lodi Loop
- 552 Lodi Loop
- 580 Lodi Loop
- 546 Lodi Loop
- 587 Lodi Loop
- 558 Lodi Loop
- 515 Lodi Loop
- 526 Lodi Loop
- 540 Lodi Loop
- 520 Lodi Loop
- 534 Lodi Loop
- 1364 Apple Cider Ct
- 1364 Apple Cider Ct Unit Apple Valley - Betwe
- 1370 Apple Cider Ct
- 1411 Fuji Way
Your Personal Tour Guide
Ask me questions while you tour the home.