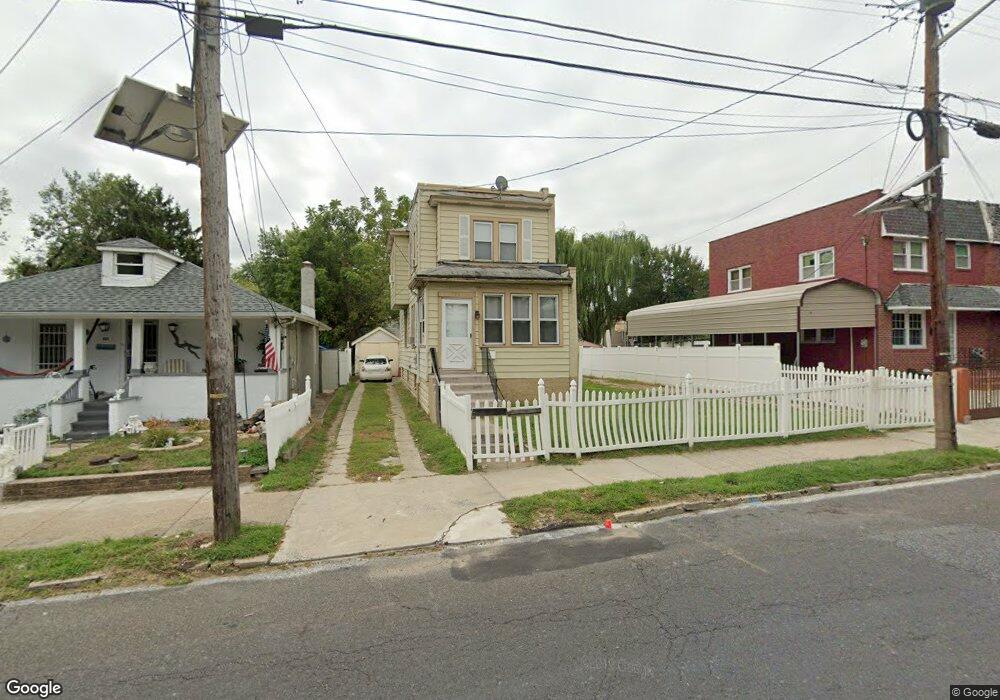
557 N 36th St Pennsauken, NJ 08110
Rosedale NeighborhoodEstimated Value: $142,000 - $236,000
3
Beds
1
Bath
1,110
Sq Ft
$173/Sq Ft
Est. Value
About This Home
This home is located at 557 N 36th St, Pennsauken, NJ 08110 and is currently estimated at $191,495, approximately $172 per square foot. 557 N 36th St is a home located in Camden County with nearby schools including Davis Elementary School, Eastside High School, and Camdens Promise Charter School.
Ownership History
Date
Name
Owned For
Owner Type
Purchase Details
Closed on
May 19, 2011
Sold by
Hud
Bought by
Ibrahim Belal
Current Estimated Value
Purchase Details
Closed on
Aug 27, 2010
Sold by
Williams Ross
Bought by
Hud
Purchase Details
Closed on
Sep 1, 1998
Sold by
Tobolsky Nelson
Bought by
Williams Ross
Home Financials for this Owner
Home Financials are based on the most recent Mortgage that was taken out on this home.
Original Mortgage
$58,844
Interest Rate
6.9%
Mortgage Type
FHA
Create a Home Valuation Report for This Property
The Home Valuation Report is an in-depth analysis detailing your home's value as well as a comparison with similar homes in the area
Home Values in the Area
Average Home Value in this Area
Purchase History
| Date | Buyer | Sale Price | Title Company |
|---|---|---|---|
| Ibrahim Belal | $55,000 | -- | |
| Hud | -- | -- | |
| Williams Ross | $58,900 | -- |
Source: Public Records
Mortgage History
| Date | Status | Borrower | Loan Amount |
|---|---|---|---|
| Previous Owner | Williams Ross | $58,844 |
Source: Public Records
Tax History Compared to Growth
Tax History
| Year | Tax Paid | Tax Assessment Tax Assessment Total Assessment is a certain percentage of the fair market value that is determined by local assessors to be the total taxable value of land and additions on the property. | Land | Improvement |
|---|---|---|---|---|
| 2025 | $2,214 | $62,500 | $21,000 | $41,500 |
| 2024 | $2,141 | $62,500 | $21,000 | $41,500 |
| 2023 | $2,141 | $62,500 | $21,000 | $41,500 |
| 2022 | $2,101 | $62,500 | $21,000 | $41,500 |
| 2021 | $2,091 | $62,500 | $21,000 | $41,500 |
| 2020 | $1,988 | $62,500 | $21,000 | $41,500 |
| 2019 | $1,903 | $62,500 | $21,000 | $41,500 |
| 2018 | $1,893 | $62,500 | $21,000 | $41,500 |
| 2017 | $1,847 | $62,500 | $21,000 | $41,500 |
| 2016 | $1,788 | $62,500 | $21,000 | $41,500 |
| 2015 | $1,721 | $62,500 | $21,000 | $41,500 |
| 2014 | $1,680 | $62,500 | $21,000 | $41,500 |
Source: Public Records
Map
Nearby Homes
- 420 N 36th St
- 619 N 32nd St
- 3743 Forrest Ave
- 3609 Westfield Ave
- 1744 43rd St
- 1627 44th St
- 1722 44th St
- 1408 Hillside Terrace
- 243 N 40th St
- 2816 Pleasant St
- 955 N 35th St
- 900 Beideman Ave
- 948 Bergen Ave
- 127 N 33rd St
- 930 N 32nd St
- 1715 47th St
- 3170 Merriel Ave
- 3265 River Ave
- 1601 47th St
- 106 N 34th St