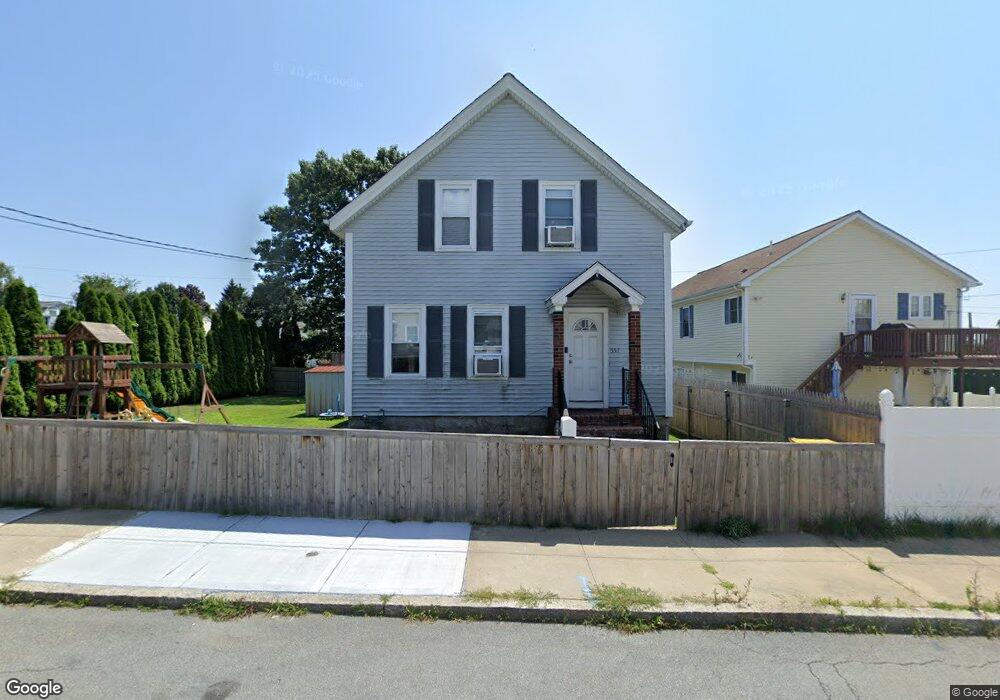
557 Tower St Fall River, MA 02721
Maplewood NeighborhoodEstimated Value: $348,000 - $433,000
4
Beds
1
Bath
1,204
Sq Ft
$318/Sq Ft
Est. Value
About This Home
This home is located at 557 Tower St, Fall River, MA 02721 and is currently estimated at $382,629, approximately $317 per square foot. 557 Tower St is a home located in Bristol County with nearby schools including Letourneau Elementary School, Matthew J. Kuss Middle School, and B M C Durfee High School.
Ownership History
Date
Name
Owned For
Owner Type
Purchase Details
Closed on
Jan 19, 2001
Sold by
Camara Jose M and Camara Maria R
Bought by
Souza Anthony M and Souza Sharon
Current Estimated Value
Purchase Details
Closed on
Jan 19, 1993
Sold by
Cabral Susan M
Bought by
Camara Jose M and Camara Maria R
Create a Home Valuation Report for This Property
The Home Valuation Report is an in-depth analysis detailing your home's value as well as a comparison with similar homes in the area
Home Values in the Area
Average Home Value in this Area
Purchase History
| Date | Buyer | Sale Price | Title Company |
|---|---|---|---|
| Souza Anthony M | $133,000 | -- | |
| Camara Jose M | $80,000 | -- |
Source: Public Records
Mortgage History
| Date | Status | Borrower | Loan Amount |
|---|---|---|---|
| Open | Camara Jose M | $134,900 | |
| Closed | Camara Jose M | $155,000 | |
| Closed | Camara Jose M | $22,200 |
Source: Public Records
Tax History
| Year | Tax Paid | Tax Assessment Tax Assessment Total Assessment is a certain percentage of the fair market value that is determined by local assessors to be the total taxable value of land and additions on the property. | Land | Improvement |
|---|---|---|---|---|
| 2025 | $3,354 | $292,900 | $118,000 | $174,900 |
| 2024 | $3,186 | $277,300 | $115,700 | $161,600 |
| 2023 | $3,043 | $248,000 | $104,300 | $143,700 |
| 2022 | $2,654 | $226,100 | $98,400 | $127,700 |
| 2021 | $2,654 | $191,900 | $94,000 | $97,900 |
| 2020 | $2,649 | $183,300 | $89,700 | $93,600 |
| 2019 | $2,656 | $182,200 | $93,700 | $88,500 |
| 2018 | $2,504 | $171,300 | $94,400 | $76,900 |
| 2017 | $2,388 | $170,600 | $94,400 | $76,200 |
| 2016 | $2,313 | $169,700 | $97,300 | $72,400 |
| 2015 | $2,184 | $167,000 | $97,300 | $69,700 |
| 2014 | $2,101 | $167,000 | $97,300 | $69,700 |
Source: Public Records
Map
Nearby Homes
Your Personal Tour Guide
Ask me questions while you tour the home.