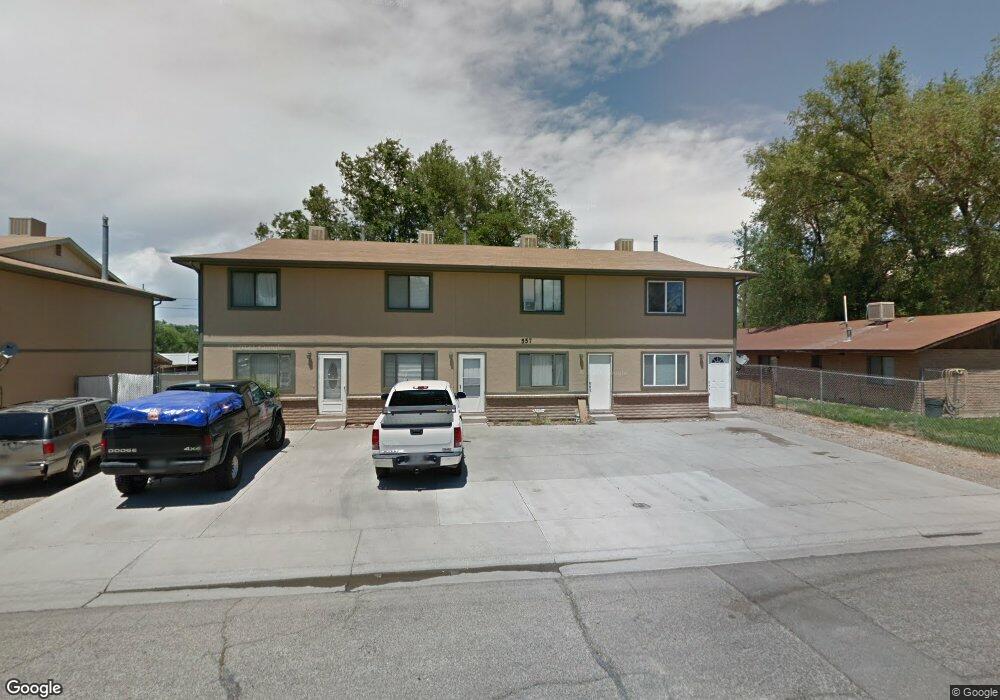
557 W Pabor Way Unit 1 Fruita, CO 81521
Estimated Value: $202,000 - $217,000
2
Beds
2
Baths
1,024
Sq Ft
$203/Sq Ft
Est. Value
About This Home
This home is located at 557 W Pabor Way Unit 1, Fruita, CO 81521 and is currently estimated at $208,320, approximately $203 per square foot. 557 W Pabor Way Unit 1 is a home located in Mesa County with nearby schools including Shelledy Elementary School, Fruita Middle School, and Fruita 8/9 School.
Ownership History
Date
Name
Owned For
Owner Type
Purchase Details
Closed on
Mar 15, 2004
Sold by
Johnson David P and Johnson Janet L
Bought by
Vigil Frank E and Vigil Beatrice
Current Estimated Value
Home Financials for this Owner
Home Financials are based on the most recent Mortgage that was taken out on this home.
Original Mortgage
$64,000
Outstanding Balance
$29,995
Interest Rate
5.71%
Mortgage Type
Purchase Money Mortgage
Estimated Equity
$178,325
Purchase Details
Closed on
Aug 19, 1994
Sold by
Bruner George T
Bought by
Vigil Frank E
Purchase Details
Closed on
Aug 24, 1991
Sold by
Bruner George T
Bought by
Vigil Frank E
Purchase Details
Closed on
Jun 15, 1957
Sold by
Dolan Grace Rosa
Bought by
Vigil Frank E
Create a Home Valuation Report for This Property
The Home Valuation Report is an in-depth analysis detailing your home's value as well as a comparison with similar homes in the area
Home Values in the Area
Average Home Value in this Area
Purchase History
| Date | Buyer | Sale Price | Title Company |
|---|---|---|---|
| Vigil Frank E | $60,000 | Meridian Land Title Llc | |
| Vigil Frank E | $40,000 | -- | |
| Vigil Frank E | -- | -- | |
| Vigil Frank E | -- | -- |
Source: Public Records
Mortgage History
| Date | Status | Borrower | Loan Amount |
|---|---|---|---|
| Open | Vigil Frank E | $64,000 |
Source: Public Records
Tax History Compared to Growth
Tax History
| Year | Tax Paid | Tax Assessment Tax Assessment Total Assessment is a certain percentage of the fair market value that is determined by local assessors to be the total taxable value of land and additions on the property. | Land | Improvement |
|---|---|---|---|---|
| 2024 | $520 | $6,370 | -- | $6,370 |
| 2023 | $520 | $6,370 | $0 | $6,370 |
| 2022 | $590 | $7,120 | $0 | $7,120 |
| 2021 | $595 | $7,330 | $0 | $7,330 |
| 2020 | $563 | $7,070 | $0 | $7,070 |
| 2019 | $536 | $7,070 | $0 | $7,070 |
| 2018 | $428 | $5,200 | $0 | $5,200 |
| 2017 | $411 | $5,200 | $0 | $5,200 |
| 2016 | $273 | $3,840 | $0 | $3,840 |
| 2015 | $277 | $3,840 | $0 | $3,840 |
| 2014 | $244 | $3,410 | $0 | $3,410 |
Source: Public Records
Map
Nearby Homes
- 565 W Pabor Way
- 128 N Coulson St
- 137 N Willow St
- 421 W Aspen Ave
- 625 S Annabelle Ct
- 740 Gold Rush Dr
- 609 S Annabelle Ct
- 456 N Annabelle Ct
- 1232 Greenway Dr
- 162 S Mulberry St
- 490 Forty Niner Dr
- 502 Birchwood St
- 308 Elderberry Dr
- 203 Elderberry Dr
- 157 N Orchard St
- 543 E Harrison Ave
- 334 W Applewood Dr
- 311 E Lexington Way
- 409 W Applewood Dr
- 234 N Sycamore St
- 557 W Pabor Way Unit 4
- 557 W Pabor Way Unit 3
- 557 W Pabor Way Unit 2
- 163 N Coulson St
- 559 W Pabor Way Unit 4
- 559 W Pabor Way Unit 3
- 559 W Pabor Way Unit 2
- 559 W Pabor Way Unit 1
- 559 W Pabor Way Unit 559 west pabor way
- 559 W Pabor Way Unit 4
- 559 W Pabor Way
- 561 W Pabor Way
- 561 W Pabor Way Unit 4
- 520 Gewont Ln
- 205 N Coulson St
- 522 Gewont Ln
- 534 Gewont Ln
- 536 Gewont Ln
- 436 W Pabor Ave
- 540 Gewont Ln