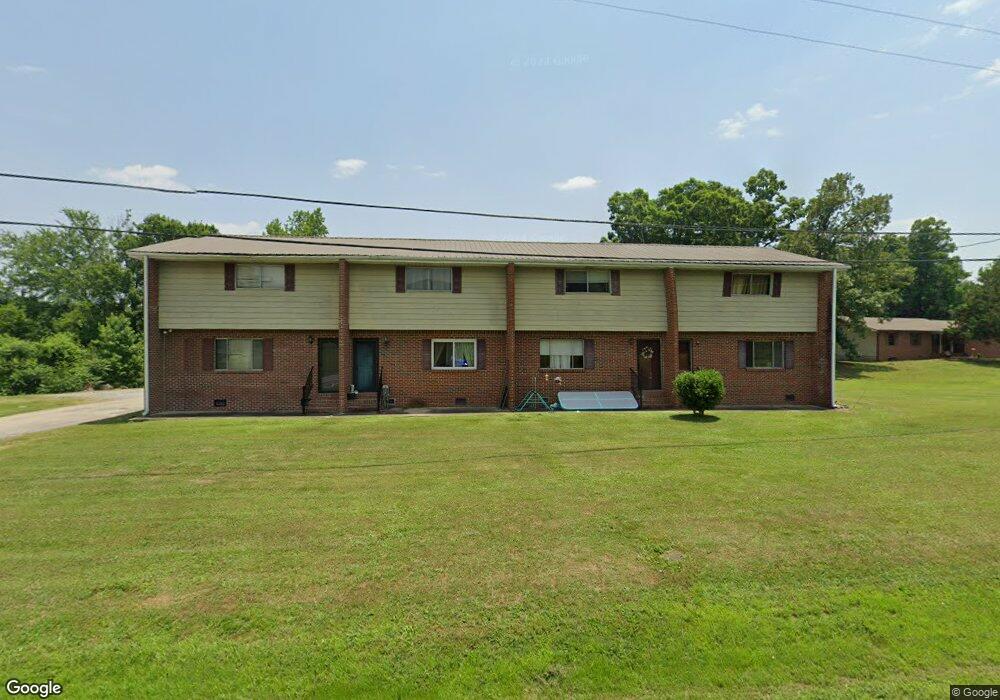
5573 Highway 193 Unit 1 Flintstone, GA 30725
High Point NeighborhoodEstimated Value: $381,107
--
Bed
2
Baths
4,704
Sq Ft
$81/Sq Ft
Est. Value
About This Home
This home is located at 5573 Highway 193 Unit 1, Flintstone, GA 30725 and is currently estimated at $381,107, approximately $81 per square foot. 5573 Highway 193 Unit 1 is a home located in Walker County with nearby schools including Chattanooga Valley Elementary School, Chattanooga Valley Middle School, and Ridgeland High School.
Ownership History
Date
Name
Owned For
Owner Type
Purchase Details
Closed on
Jun 5, 2023
Sold by
Bloodworth Diane S
Bought by
View Point Realty Llc
Current Estimated Value
Purchase Details
Closed on
Apr 3, 2012
Sold by
Burnette Randall W
Bought by
Bloodworth Hansel L and Bloodworth Diane S
Purchase Details
Closed on
Dec 14, 2006
Sold by
Burnette Randall W
Bought by
Chickamauga Telephone Corp
Purchase Details
Closed on
Oct 6, 2005
Sold by
Wooten Rockey M
Bought by
Burnette Randall W and Burnette Barbara N
Purchase Details
Closed on
Nov 15, 2002
Sold by
Floyd Charlie E and Floyd Hazel
Bought by
Wooten Rocky M and Wooten Susan C
Purchase Details
Closed on
May 26, 1972
Sold by
Adkins Albert and Adkins Hazel
Bought by
Floyd Charlie E and Floyd Hazel
Purchase Details
Closed on
Jul 24, 1970
Bought by
Adkins Albert and Adkins Hazel
Create a Home Valuation Report for This Property
The Home Valuation Report is an in-depth analysis detailing your home's value as well as a comparison with similar homes in the area
Home Values in the Area
Average Home Value in this Area
Purchase History
| Date | Buyer | Sale Price | Title Company |
|---|---|---|---|
| View Point Realty Llc | $340,000 | -- | |
| Bloodworth Hansel L | $168,000 | -- | |
| Chickamauga Telephone Corp | $5,000 | -- | |
| Burnette Randall W | -- | -- | |
| Wooten Rocky M | $150,000 | -- | |
| Floyd Charlie E | -- | -- | |
| Adkins Albert | -- | -- |
Source: Public Records
Tax History Compared to Growth
Tax History
| Year | Tax Paid | Tax Assessment Tax Assessment Total Assessment is a certain percentage of the fair market value that is determined by local assessors to be the total taxable value of land and additions on the property. | Land | Improvement |
|---|---|---|---|---|
| 2024 | $3,421 | $141,301 | $12,610 | $128,691 |
| 2023 | $2,783 | $102,522 | $12,150 | $90,372 |
| 2022 | $1,802 | $57,330 | $6,075 | $51,255 |
| 2021 | $1,940 | $57,170 | $6,075 | $51,095 |
| 2020 | $2,218 | $65,477 | $6,075 | $59,402 |
| 2019 | $2,253 | $65,477 | $6,075 | $59,402 |
| 2018 | $1,733 | $65,477 | $6,075 | $59,402 |
| 2017 | $2,432 | $65,477 | $6,075 | $59,402 |
| 2016 | $2,002 | $65,477 | $6,075 | $59,402 |
| 2015 | $2,100 | $65,253 | $6,464 | $58,789 |
| 2014 | $1,846 | $65,253 | $6,464 | $58,789 |
| 2013 | -- | $58,798 | $6,464 | $52,334 |
Source: Public Records
Map
Nearby Homes
- 206 Elaine Dr
- 3509 N Highway N 341
- 3509 N Highway 341
- 2255 Nick-A Jack Rd
- 144 N Victor Dr
- 0 Cloud 9 Ln Unit RTC2915945
- 0 Cloud 9 Ln Unit 1514939
- 19 Turkey Run
- 433 Stanford Dr
- 0 Roundtree Ct Unit RTC2914889
- 0 Roundtree Ct Unit 1514898
- 1854 Powder Springs Cir
- 244 Haven Hill
- 301 Hidden Oaks Dr
- 404 W Schmitt Rd
- 529 Hidden Oaks Dr
- 309 W Schmitt Rd
- 77 Kelley Ln
- 120 Williams Ave
- 675 Mill Wee Hollow Rd
- 5573 Highway 193
- 5573 Georgia 193
- 193 Highway
- 5634 Highway 193
- 0 Nick A Jack Rd
- 0 Nick A Jack Rd Unit 1138731
- 85 Nick-A Jack Rd
- 58 Nick A Jack Rd
- 5686 Highway 193
- 5686 Highway 193
- 189 Nick A Jack Rd
- 154 Nick A Jack Rd
- 203 Nick-A Jack Rd
- 189 Nick A Jack Ln
- 93 Nick A Jack Ln
- 190 Nick A Jack Rd
- 235 Nick-A Jack Rd
- 235 Nick A Jack Rd
- 289 Holmes Dr
- 271 Nick A Jack Rd