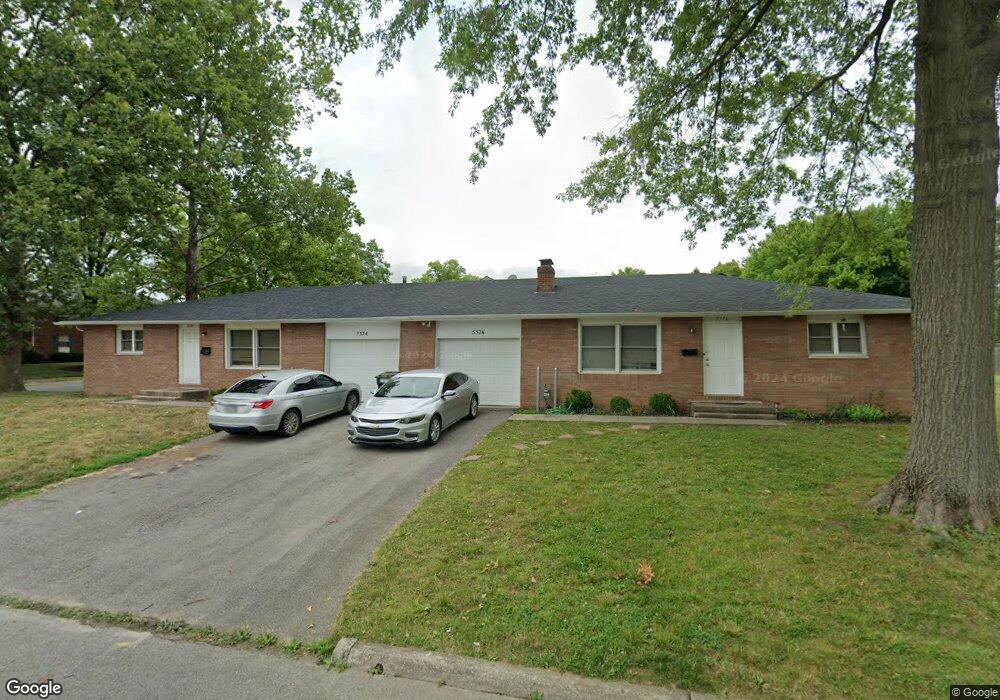
5574-5576 Hardwick Dr Columbus, OH 43232
Walnut Hills NeighborhoodEstimated Value: $286,000 - $334,000
4
Beds
2
Baths
2,510
Sq Ft
$124/Sq Ft
Est. Value
About This Home
This home is located at 5574-5576 Hardwick Dr, Columbus, OH 43232 and is currently estimated at $312,408, approximately $124 per square foot. 5574-5576 Hardwick Dr is a home located in Franklin County with nearby schools including Oakmont Elementary School, Yorktown Middle School, and Independence High School.
Ownership History
Date
Name
Owned For
Owner Type
Purchase Details
Closed on
Jan 30, 2019
Sold by
Walnut Hil Park Association
Bought by
Arch City Realty Grop Llc
Current Estimated Value
Home Financials for this Owner
Home Financials are based on the most recent Mortgage that was taken out on this home.
Original Mortgage
$132,750
Outstanding Balance
$116,711
Interest Rate
4.5%
Mortgage Type
New Conventional
Estimated Equity
$195,697
Purchase Details
Closed on
Aug 3, 2018
Sold by
Wilmington Saving Fund Society Fsb
Bought by
Arch City Realty Group Llc
Purchase Details
Closed on
Jul 12, 2018
Sold by
Pennell Janet Eileen and Pennell Janet K
Bought by
Wilmington Savings Fund Society Fsb and Chrsitiana Trust
Purchase Details
Closed on
Feb 5, 1982
Bought by
Pennell Janet K
Create a Home Valuation Report for This Property
The Home Valuation Report is an in-depth analysis detailing your home's value as well as a comparison with similar homes in the area
Home Values in the Area
Average Home Value in this Area
Purchase History
| Date | Buyer | Sale Price | Title Company |
|---|---|---|---|
| Arch City Realty Grop Llc | -- | Land And Mortgage Title Box | |
| Arch City Realty Group Llc | $126,300 | Servicelink | |
| Wilmington Savings Fund Society Fsb | $111,000 | None Available | |
| Pennell Janet K | -- | -- |
Source: Public Records
Mortgage History
| Date | Status | Borrower | Loan Amount |
|---|---|---|---|
| Open | Arch City Realty Grop Llc | $132,750 |
Source: Public Records
Tax History Compared to Growth
Tax History
| Year | Tax Paid | Tax Assessment Tax Assessment Total Assessment is a certain percentage of the fair market value that is determined by local assessors to be the total taxable value of land and additions on the property. | Land | Improvement |
|---|---|---|---|---|
| 2024 | $3,932 | $85,790 | $21,000 | $64,790 |
| 2023 | $3,882 | $85,790 | $21,000 | $64,790 |
| 2022 | $2,893 | $54,430 | $24,150 | $30,280 |
| 2021 | $2,898 | $54,430 | $24,150 | $30,280 |
| 2020 | $2,902 | $54,430 | $24,150 | $30,280 |
| 2019 | $2,942 | $47,320 | $21,000 | $26,320 |
| 2018 | $2,450 | $47,320 | $21,000 | $26,320 |
| 2017 | $4,567 | $47,320 | $21,000 | $26,320 |
| 2016 | $6,033 | $49,700 | $7,980 | $41,720 |
| 2015 | $3,513 | $49,700 | $7,980 | $41,720 |
| 2014 | $3,039 | $49,700 | $7,980 | $41,720 |
| 2013 | $1,577 | $52,290 | $8,365 | $43,925 |
Source: Public Records
Map
Nearby Homes
- 1942 Bairsford Dr Unit 944
- 5596 Autumn Chase Dr
- 1835 Woodette Rd
- 1930 Walnut Hill Park Dr
- 1759 Lonsdale Rd
- 5337 Ivyhurst Dr
- 1718 Sunapple Way
- 1591 Stephanie Ct Unit 15912
- 5366 Yorkshire Village Ln Unit B-22
- 1616 Coppertree Rd Unit 1615
- 5846 Riverton Rd
- 1945 Riverdale Rd
- 0 Radekin Rd Unit 225029852
- 5036 Brinwood Place
- 1314 Yorkland Rd Unit C
- 0 Brice Rd
- 6156 Roselawn Ave
- 1486 Efner Dr
- 6348 E Livingston Ave
- 5123 Jameson Dr
- 5574 Hardwick Dr Unit 576
- 1838 Bairsford Dr Unit 840
- 5571 Hardwick Dr Unit 573
- 1832-1834 Bairsford Dr
- 1832 Bairsford Dr Unit 834
- 1913 Birkdale Dr
- 1911 Birkdale Dr
- 1864 Bairsford Dr Unit 866
- 5591 Hardwick Dr
- 1826-1828 Bairsford Dr
- 1826 Bairsford Dr Unit 828
- 1826 Bairsford Dr Unit 1828
- 1828 Bairsford Dr
- 1909 Birkdale Dr
- 1874 Bairsford Dr Unit 876
- 1917 Birkdale Dr
- 1820 Bairsford Dr Unit 822
- 1822 Bairsford Dr
- 1907 Birkdale Dr
- 1882 Bairsford Dr Unit 884