Estimated payment $2,345/month
Highlights
- Private Pool
- Mature Trees
- Rambler Architecture
- RV Access or Parking
- Mountain View
- Hydromassage or Jetted Bathtub
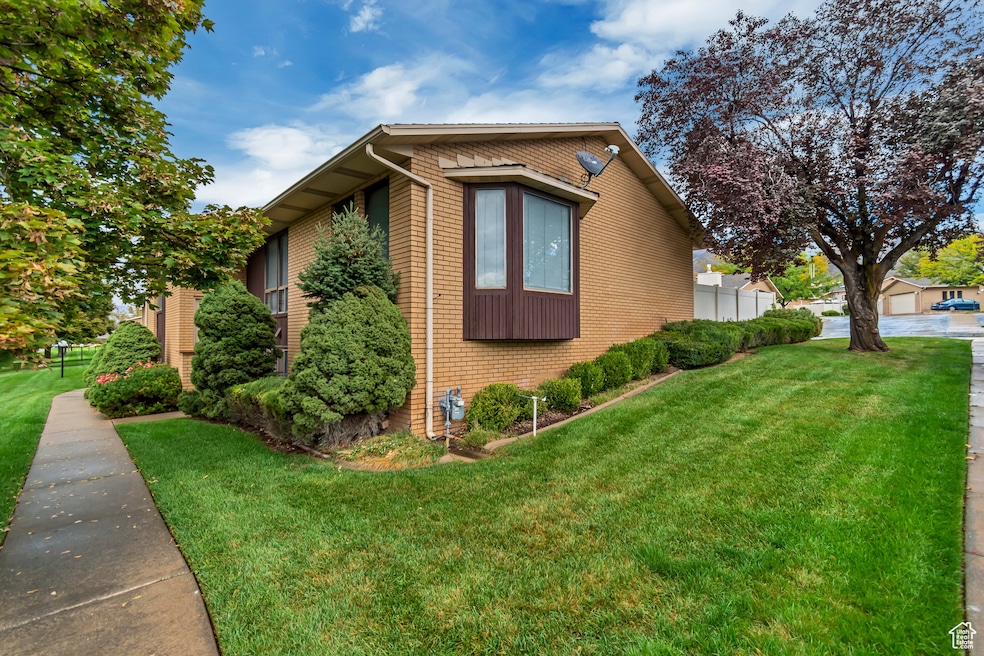
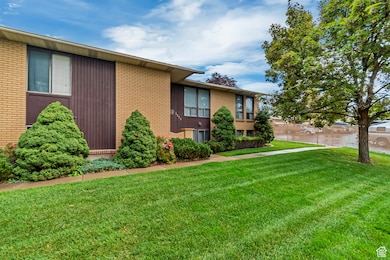
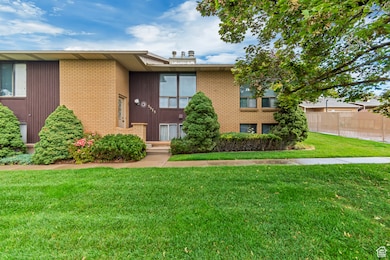
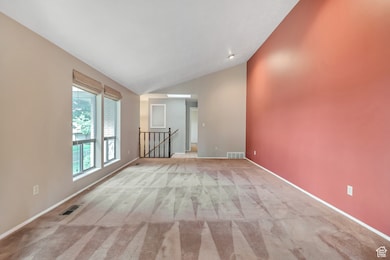
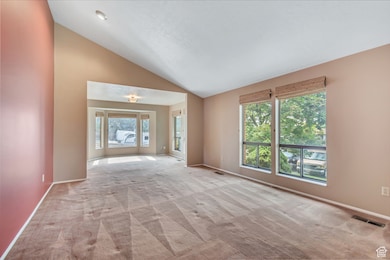
About This Home
Well-maintained 4-bedroom, 2-bathroom condo in Ogden. Quiet community. Convenient Hwy 89 access for easy commutes. Situated within minutes to Ogden Regional Medical Center and downtown Ogden. Close to schools, shopping and entertainment. Quick access to mountains for recreation.
Property Details
Home Type
- Condominium
Est. Annual Taxes
- $2,254
Year Built
- Built in 1982
Lot Details
- Landscaped
- Mature Trees
HOA Fees
- $264 Monthly HOA Fees
Parking
- 2 Car Attached Garage
- RV Access or Parking
Home Design
- Rambler Architecture
- Brick Exterior Construction
- Asphalt Roof
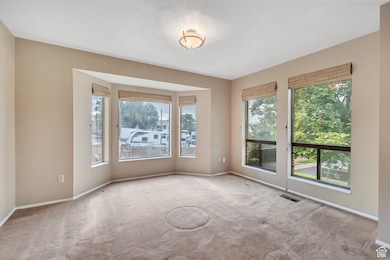
Interior Spaces
- 3,176 Sq Ft Home
- 2-Story Property
- Central Vacuum
- Ceiling Fan
- Skylights
- 2 Fireplaces
- Gas Log Fireplace
- Double Pane Windows
- Blinds
- Drapes & Rods
- Den
- Mountain Views
- Basement Fills Entire Space Under The House
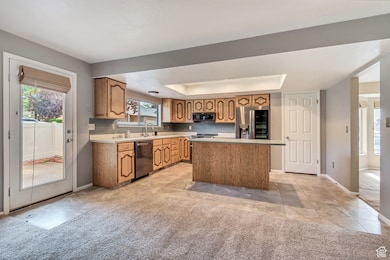
Kitchen
- Free-Standing Range
- Range Hood
- Microwave
- Trash Compactor
- Disposal
Flooring
- Carpet
- Laminate
- Tile
- Vinyl
Bedrooms and Bathrooms
- 4 Bedrooms | 2 Main Level Bedrooms
- Walk-In Closet
- Hydromassage or Jetted Bathtub
Laundry
- Dryer
- Washer
- Laundry Chute
Home Security
Outdoor Features
- Private Pool
- Exterior Lighting
Schools
- H. Guy Child Elementary School
- South Ogden Middle School
- Bonneville High School
Utilities
- Forced Air Heating and Cooling System
- Water Softener is Owned
- Satellite Dish
Listing and Financial Details
- Assessor Parcel Number 07-252-0006
Community Details
Overview
- Association fees include insurance, ground maintenance
- Ironwood Subdivision
- Maintained Community
Recreation
- Community Pool
- Snow Removal
Security
- Storm Doors
Map
Home Values in the Area
Average Home Value in this Area
Tax History
| Year | Tax Paid | Tax Assessment Tax Assessment Total Assessment is a certain percentage of the fair market value that is determined by local assessors to be the total taxable value of land and additions on the property. | Land | Improvement |
|---|---|---|---|---|
| 2025 | $2,361 | $352,540 | $100,000 | $252,540 |
| 2024 | $2,254 | $189,200 | $55,000 | $134,200 |
| 2023 | $2,296 | $219,450 | $55,000 | $164,450 |
| 2022 | $2,611 | $228,250 | $55,000 | $173,250 |
| 2021 | $2,306 | $342,000 | $60,000 | $282,000 |
| 2020 | $2,037 | $282,000 | $38,000 | $244,000 |
| 2019 | $1,957 | $261,000 | $38,000 | $223,000 |
| 2018 | $1,636 | $207,000 | $38,000 | $169,000 |
| 2017 | $1,456 | $179,000 | $38,000 | $141,000 |
| 2016 | $1,246 | $85,800 | $18,150 | $67,650 |
| 2015 | $1,270 | $85,800 | $18,150 | $67,650 |
| 2014 | $1,223 | $81,400 | $18,150 | $63,250 |
Property History
| Date | Event | Price | List to Sale | Price per Sq Ft |
|---|---|---|---|---|
| 01/09/2026 01/09/26 | Price Changed | $359,900 | -2.7% | $113 / Sq Ft |
| 01/08/2026 01/08/26 | For Sale | $369,900 | 0.0% | $116 / Sq Ft |
| 01/06/2026 01/06/26 | Off Market | -- | -- | -- |
| 11/14/2025 11/14/25 | Price Changed | $369,900 | -2.6% | $116 / Sq Ft |
| 10/27/2025 10/27/25 | Price Changed | $379,900 | -3.8% | $120 / Sq Ft |
| 10/06/2025 10/06/25 | For Sale | $395,000 | -- | $124 / Sq Ft |
Purchase History
| Date | Type | Sale Price | Title Company |
|---|---|---|---|
| Warranty Deed | -- | Premier Title Insurance Agen | |
| Interfamily Deed Transfer | -- | -- | |
| Interfamily Deed Transfer | -- | -- |
Mortgage History
| Date | Status | Loan Amount | Loan Type |
|---|---|---|---|
| Open | $78,000 | New Conventional |
Source: UtahRealEstate.com
MLS Number: 2115770
APN: 07-252-0006
Disclaimer: Certain information contained herein is derived from information provided by parties other than Homes.com. All information provided is deemed reliable, but is not guaranteed to be accurate and should be independently verified.
![]() IDX information is provided exclusively for consumers’ personal, non-commercial use, that it may not be used for any purpose other than to identify prospective properties consumers may be interested in purchasing, and that the data is deemed reliable but is not guaranteed accurate by the MLS. Licensor is only providing the MLS Content and not other sources of data provided in the Product.
IDX information is provided exclusively for consumers’ personal, non-commercial use, that it may not be used for any purpose other than to identify prospective properties consumers may be interested in purchasing, and that the data is deemed reliable but is not guaranteed accurate by the MLS. Licensor is only providing the MLS Content and not other sources of data provided in the Product.
Based on information from the Wasatch Front Regional Multiple Listing Service, Inc.. All data, including all measurements and calculations of area, is obtained from various sources and has not been, and will not be, verified by broker or the MLS. All information should be independently reviewed and verified for accuracy. Properties may or may not be listed by the office/agent presenting the information.
- 5558 S 1025 E
- 992 E 5625 S
- 980 E 5475 S
- 1046 E 5675 S
- 1069 E 5600 S
- 5518 S 875 E
- 5631 S 1075 E
- 1014 E 5750 S
- 5540 S 850 E
- 856 E 5575 S
- 5760 S 1050 E
- 5698 S 1150 E
- 1143 E 5275 S Unit 33
- 1205 E 5275 S Unit 34
- 5619 S Fox Chase Dr E
- 1225 E 5275 S
- 5523 S 700 E
- 889 Ben Lomond Ave
- 5331 S 750 E
- 649 E 5650 S
- 1268 E 5600 S Unit B
- 1055 E 5050 S
- 5030 Harrison Blvd
- 6045 S Ridgeline Dr
- 4935 Old Post Rd
- 5785 Wasatch Dr
- 6019 S Wasatch Dr
- 4400 Washington Blvd
- 167 E 4700 S
- 167-4700 4700 S
- 520 E South Weber Dr Unit A1
- 564 W 5275 S
- 955 Country Hills Dr
- 4050 Madison Ave
- 635 E 40th St
- 557 Laker Way
- 4010 Adams Ave
- 4535 S Ridgeline Dr
- 3765 Harrison Blvd
- 3813 Ogden Ave Unit Suite C
