Estimated Value: $243,000 - $253,928
3
Beds
2
Baths
1,120
Sq Ft
$222/Sq Ft
Est. Value
About This Home
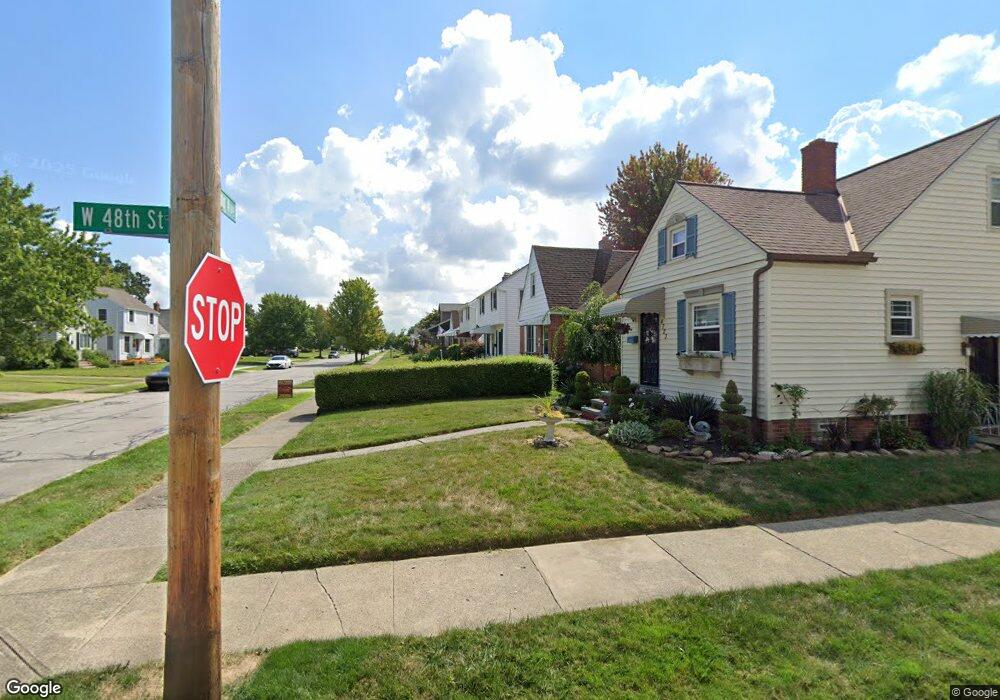
This home is located at 5575 W 48th St, Parma, OH 44134 and is currently estimated at $248,482, approximately $221 per square foot. 5575 W 48th St is a home located in Cuyahoga County with nearby schools including Thoreau Park Elementary School, Shiloh Middle School, and Parma High School.
Ownership History
Date
Name
Owned For
Owner Type
Purchase Details
Closed on
Jul 27, 2023
Sold by
Kolaczko Andreas D and Kolaczko Jamison
Bought by
Santiago Ricardo F
Current Estimated Value
Home Financials for this Owner
Home Financials are based on the most recent Mortgage that was taken out on this home.
Original Mortgage
$227,260
Outstanding Balance
$218,738
Interest Rate
4%
Mortgage Type
VA
Estimated Equity
$29,744
Purchase Details
Closed on
Dec 3, 2020
Sold by
Sheriff Of Cuyahoga County and Hsbc Bank Usa Na
Bought by
Suburban West Llc
Purchase Details
Closed on
May 18, 1988
Sold by
Ruban Olexa
Bought by
Ruban Ursula A
Purchase Details
Closed on
Dec 21, 1981
Sold by
Kapera Florian A
Bought by
Ruban Olexa
Purchase Details
Closed on
Jan 30, 1976
Sold by
Disantis Paul A and Disantis Patricia J
Bought by
Kapera Florian A
Purchase Details
Closed on
Jan 1, 1975
Bought by
Disantis Paul A and Disantis Patricia J
Create a Home Valuation Report for This Property
The Home Valuation Report is an in-depth analysis detailing your home's value as well as a comparison with similar homes in the area
Home Values in the Area
Average Home Value in this Area
Purchase History
| Date | Buyer | Sale Price | Title Company |
|---|---|---|---|
| Santiago Ricardo F | $220,000 | Infinity Title | |
| Suburban West Llc | $95,100 | Land Title | |
| Ruban Ursula A | -- | -- | |
| Ruban Olexa | $61,900 | -- | |
| Kapera Florian A | $40,000 | -- | |
| Disantis Paul A | -- | -- |
Source: Public Records
Mortgage History
| Date | Status | Borrower | Loan Amount |
|---|---|---|---|
| Open | Santiago Ricardo F | $227,260 |
Source: Public Records
Tax History Compared to Growth
Tax History
| Year | Tax Paid | Tax Assessment Tax Assessment Total Assessment is a certain percentage of the fair market value that is determined by local assessors to be the total taxable value of land and additions on the property. | Land | Improvement |
|---|---|---|---|---|
| 2024 | $4,566 | $77,000 | $12,110 | $64,890 |
| 2023 | $2,966 | $40,640 | $10,010 | $30,630 |
| 2022 | $2,876 | $40,635 | $10,010 | $30,625 |
| 2021 | $2,958 | $40,640 | $10,010 | $30,630 |
| 2020 | $2,592 | $31,260 | $7,700 | $23,560 |
| 2019 | $2,479 | $89,300 | $22,000 | $67,300 |
| 2018 | $2,316 | $31,260 | $7,700 | $23,560 |
| 2017 | $2,300 | $26,750 | $5,780 | $20,970 |
| 2016 | $2,286 | $26,750 | $5,780 | $20,970 |
| 2015 | $2,173 | $26,750 | $5,780 | $20,970 |
| 2014 | $2,173 | $27,300 | $5,880 | $21,420 |
Source: Public Records
Map
Nearby Homes
- 5521 W 48th St
- 5000 Torrington Ave
- 4420 Torrington Ave
- 4409 Milford Ave
- 5212 Wood Ave
- 4323 Russell Ave
- 4915 Tuxedo Ave
- 4000 Pershing Ave
- 4005 Pershing Ave
- 3910 Wood Ave
- 4439 Woodway Ave
- 3710 Wood Ave
- 5618 Bradley Ave
- 5815 Westlake Ave
- 4315 Woodway Ave
- 4206 Liggett Dr
- 4311 Woodway Ave
- 5252 W 45th St
- 3714 Russell Ave
- 5511 Velma Ave
- 5515 W 48th St
- 5509 W 48th St
- 5527 W 48th St
- 5531 W 48th St
- 5515 Goans Place
- Goans Place
- 5501 Goans Place
- 4802 Montauk Ave
- 4528 Milford Ave
- 4803 Montauk Ave
- 4806 Montauk Ave
- 4604 Milford Ave
- 4712 Torrington Ave
- 4718 Torrington Ave
- 4708 Torrington Ave
- 4700 Torrington Ave
- 5493 Goans Place
- 5502 Goans Place
- 4524 Milford Ave
- 4610 Milford Ave