55761 Bel Haven Bellaire, OH 43906
Estimated Value: $141,229 - $172,000
3
Beds
1
Bath
1,190
Sq Ft
$132/Sq Ft
Est. Value
About This Home
This home is located at 55761 Bel Haven, Bellaire, OH 43906 and is currently estimated at $157,307, approximately $132 per square foot. 55761 Bel Haven is a home located in Belmont County with nearby schools including Bellaire Elementary School, Bellaire Middle School, and Bellaire High School.
Ownership History
Date
Name
Owned For
Owner Type
Purchase Details
Closed on
Aug 24, 2020
Sold by
Shubat Charles S and Shubat Jana M
Bought by
Evick Randall J and Evick Jessi
Current Estimated Value
Purchase Details
Closed on
Feb 28, 2013
Sold by
Shubat Charles S and Shubat Jana M
Bought by
Evick Randall J and Tarter Jessi
Home Financials for this Owner
Home Financials are based on the most recent Mortgage that was taken out on this home.
Original Mortgage
$50,000
Interest Rate
3.49%
Mortgage Type
Seller Take Back
Purchase Details
Closed on
Jan 3, 2013
Sold by
Estate Of Charles S Shubat
Bought by
Shubat Charles S and Shubat Stephanie J
Home Financials for this Owner
Home Financials are based on the most recent Mortgage that was taken out on this home.
Original Mortgage
$50,000
Interest Rate
3.49%
Mortgage Type
Seller Take Back
Purchase Details
Closed on
Jan 1, 1987
Sold by
Shubat Charles S and Shubat Ida M
Bought by
Shubat Charles S and Surv Ida M
Create a Home Valuation Report for This Property
The Home Valuation Report is an in-depth analysis detailing your home's value as well as a comparison with similar homes in the area
Home Values in the Area
Average Home Value in this Area
Purchase History
| Date | Buyer | Sale Price | Title Company |
|---|---|---|---|
| Evick Randall J | -- | None Available | |
| Evick Randall J | $10,000 | Attorney | |
| Shubat Charles S | -- | None Available | |
| Shubat Charles S | -- | -- |
Source: Public Records
Mortgage History
| Date | Status | Borrower | Loan Amount |
|---|---|---|---|
| Previous Owner | Evick Randall J | $50,000 |
Source: Public Records
Tax History Compared to Growth
Tax History
| Year | Tax Paid | Tax Assessment Tax Assessment Total Assessment is a certain percentage of the fair market value that is determined by local assessors to be the total taxable value of land and additions on the property. | Land | Improvement |
|---|---|---|---|---|
| 2024 | $1,407 | $38,490 | $5,190 | $33,300 |
| 2023 | $1,351 | $34,020 | $5,120 | $28,900 |
| 2022 | $1,351 | $34,019 | $5,120 | $28,899 |
| 2021 | $1,347 | $34,019 | $5,120 | $28,899 |
| 2020 | $1,228 | $29,580 | $4,450 | $25,130 |
| 2019 | $1,229 | $29,580 | $4,450 | $25,130 |
| 2018 | $1,221 | $29,580 | $4,450 | $25,130 |
| 2017 | $1,280 | $31,430 | $4,910 | $26,520 |
| 2016 | $1,281 | $31,430 | $4,910 | $26,520 |
| 2015 | $1,331 | $31,430 | $4,910 | $26,520 |
| 2014 | $1,098 | $26,210 | $4,470 | $21,740 |
| 2013 | $988 | $26,210 | $4,470 | $21,740 |
Source: Public Records
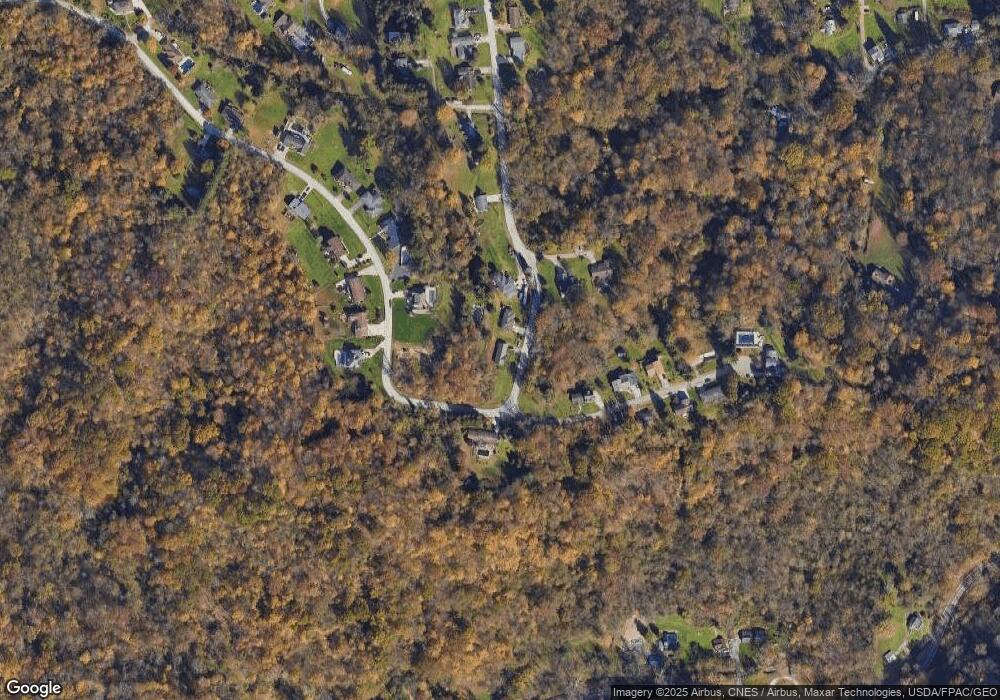
Map
Nearby Homes
- 55794 Bel Haven
- 55584 Bel Haven
- 56068 Key Bellaire Rd
- 55899 Poplar Dr
- 56260 Key Bellaire Rd
- 56929 Winding Hill Rd
- 1020 Maple Ave
- 2364 W 23rd St
- 0 Elm St
- 1257 Maple Ave
- 64301 Shady Lane Rd
- 306 Frazier Ave
- 316 Dorer Ave
- 339 W 22nd St
- 1070 Central Ave
- 55201 New Cut Rd
- 958 Central Ave
- 0 Fulton Hill Rd (Cr 42) Unit 5129179
- 54420 Key Bellaire Rd
- 320 322 34th St
- 55765 Bel Haven
- 55797 Bel Haven
- 55673 Bel Haven
- 55740 Bel Haven
- 56021 Governor Dr
- 55794 Bell Haven
- 56039 Governor Dr
- 55688 Bell Haven
- 55792 Bel Haven
- 55688 Bel Haven
- 55811 Bel Haven
- 55682 Bel Haven
- 55664 Bel Haven
- 56061 Governor Dr
- 56052 Governor Dr
- 56052 Governor Dr
- 55641 Bel Haven
- 55650 Bel Haven
- 56062 Governor Dr
- 55841 Bel Haven