Estimated Value: $528,000 - $576,000
4
Beds
4
Baths
2,802
Sq Ft
$195/Sq Ft
Est. Value
About This Home
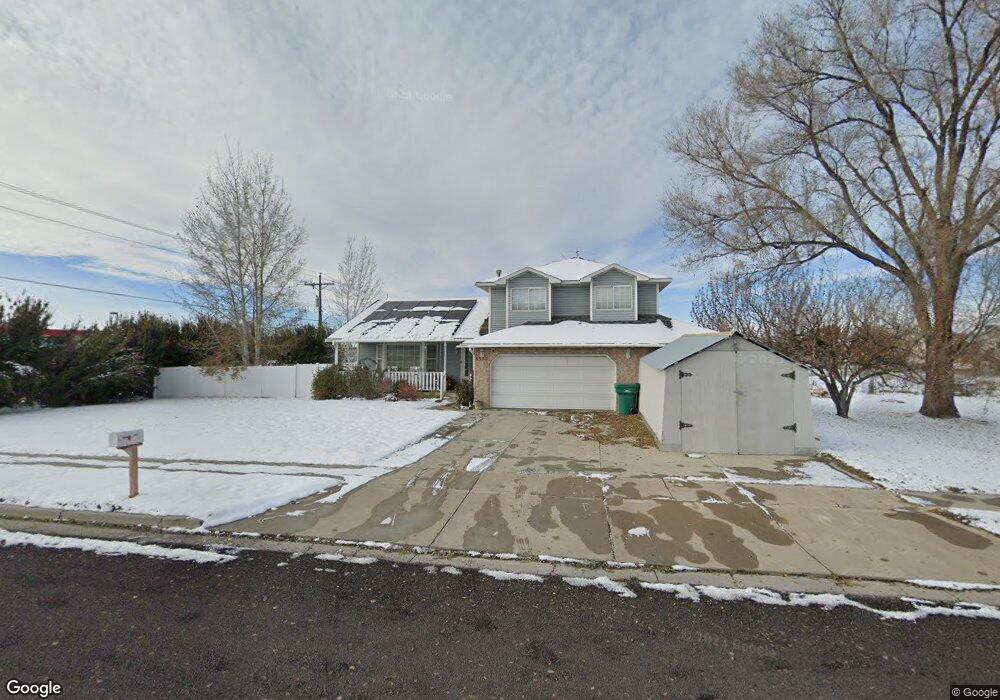
This home is located at 5577 S 3450 W, Roy, UT 84067 and is currently estimated at $546,720, approximately $195 per square foot. 5577 S 3450 W is a home located in Weber County with nearby schools including Roy Elementary School, Roy Junior High School, and Roy High School.
Ownership History
Date
Name
Owned For
Owner Type
Purchase Details
Closed on
Feb 18, 2023
Sold by
Hanor Gina L
Bought by
Utah Department Of Transportation
Current Estimated Value
Purchase Details
Closed on
Oct 13, 2017
Sold by
Bovee Ro0ger L
Bought by
Hanor Giua L
Home Financials for this Owner
Home Financials are based on the most recent Mortgage that was taken out on this home.
Original Mortgage
$246,415
Interest Rate
3.82%
Mortgage Type
New Conventional
Purchase Details
Closed on
Nov 7, 2006
Sold by
Robison Robin L
Bought by
Bovee Roger L and Bovee Constance D
Home Financials for this Owner
Home Financials are based on the most recent Mortgage that was taken out on this home.
Original Mortgage
$176,000
Interest Rate
6.3%
Mortgage Type
Purchase Money Mortgage
Create a Home Valuation Report for This Property
The Home Valuation Report is an in-depth analysis detailing your home's value as well as a comparison with similar homes in the area
Home Values in the Area
Average Home Value in this Area
Purchase History
| Date | Buyer | Sale Price | Title Company |
|---|---|---|---|
| Utah Department Of Transportation | -- | None Listed On Document | |
| Utah Department Of Transportation | -- | None Listed On Document | |
| Hanor Giua L | -- | Old Republic Title | |
| Bovee Roger L | -- | Founders Title Company |
Source: Public Records
Mortgage History
| Date | Status | Borrower | Loan Amount |
|---|---|---|---|
| Previous Owner | Hanor Giua L | $246,415 | |
| Previous Owner | Bovee Roger L | $176,000 |
Source: Public Records
Tax History Compared to Growth
Tax History
| Year | Tax Paid | Tax Assessment Tax Assessment Total Assessment is a certain percentage of the fair market value that is determined by local assessors to be the total taxable value of land and additions on the property. | Land | Improvement |
|---|---|---|---|---|
| 2025 | $3,414 | $531,731 | $130,205 | $401,526 |
| 2024 | $3,340 | $287,099 | $71,646 | $215,453 |
| 2023 | $3,210 | $276,100 | $71,453 | $204,647 |
| 2022 | $3,096 | $271,150 | $58,824 | $212,326 |
| 2021 | $2,714 | $391,000 | $79,063 | $311,937 |
| 2020 | $2,543 | $336,000 | $79,063 | $256,937 |
| 2019 | $2,504 | $313,000 | $51,230 | $261,770 |
| 2018 | $2,235 | $276,000 | $46,557 | $229,443 |
| 2017 | $2,037 | $242,000 | $50,061 | $191,939 |
| 2016 | $1,856 | $118,150 | $24,743 | $93,407 |
| 2015 | $1,794 | $113,024 | $24,743 | $88,281 |
| 2014 | $1,754 | $108,192 | $24,743 | $83,449 |
Source: Public Records
Map
Nearby Homes