Estimated Value: $467,000 - $548,000
4
Beds
4
Baths
1,708
Sq Ft
$291/Sq Ft
Est. Value
About This Home
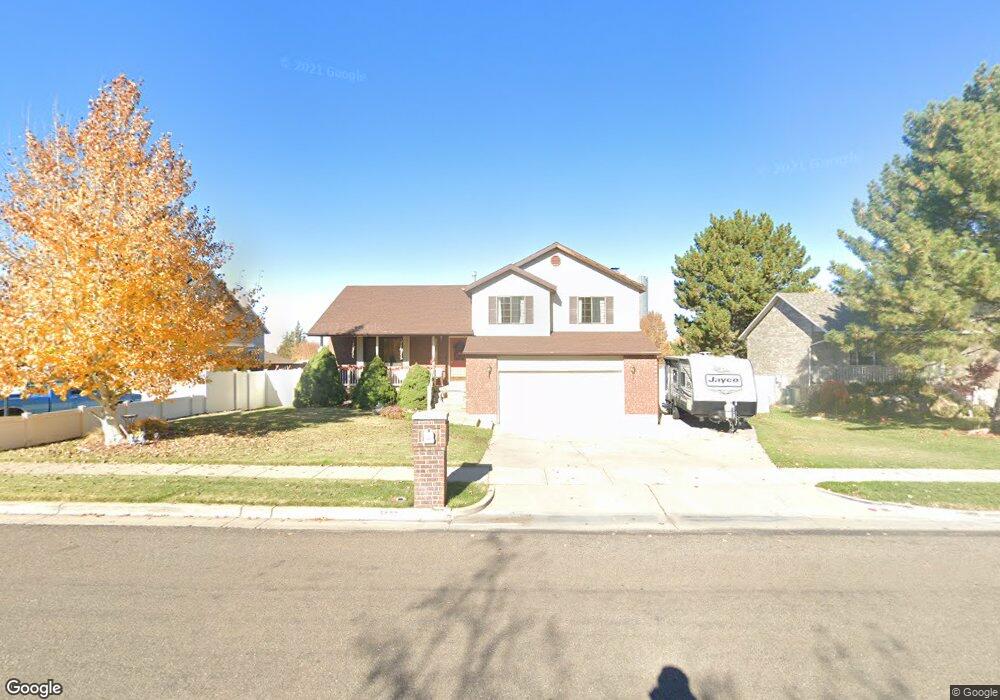
This home is located at 5577 S Ridgeline Dr, Ogden, UT 84405 and is currently estimated at $497,424, approximately $291 per square foot. 5577 S Ridgeline Dr is a home located in Weber County with nearby schools including Roosevelt School, T.H. Bell Junior High School, and Bonneville High School.
Ownership History
Date
Name
Owned For
Owner Type
Purchase Details
Closed on
Oct 19, 2020
Sold by
Barnes Steven L
Bought by
Barnes Steven L and Barnes Lori A
Current Estimated Value
Home Financials for this Owner
Home Financials are based on the most recent Mortgage that was taken out on this home.
Original Mortgage
$220,000
Outstanding Balance
$195,322
Interest Rate
2.8%
Mortgage Type
New Conventional
Estimated Equity
$302,102
Purchase Details
Closed on
Mar 7, 2003
Sold by
Barnes Steve L
Bought by
Barnes Steven L
Home Financials for this Owner
Home Financials are based on the most recent Mortgage that was taken out on this home.
Original Mortgage
$145,850
Interest Rate
5.83%
Purchase Details
Closed on
Sep 27, 2001
Sold by
Coates Scott A and Coates Leslee B
Bought by
Barnes Steve L
Home Financials for this Owner
Home Financials are based on the most recent Mortgage that was taken out on this home.
Original Mortgage
$144,400
Interest Rate
6.91%
Create a Home Valuation Report for This Property
The Home Valuation Report is an in-depth analysis detailing your home's value as well as a comparison with similar homes in the area
Home Values in the Area
Average Home Value in this Area
Purchase History
| Date | Buyer | Sale Price | Title Company |
|---|---|---|---|
| Barnes Steven L | -- | Servicelink East Escrow | |
| Barnes Steven L | -- | Us Title | |
| Barnes Steve L | -- | Equity Title |
Source: Public Records
Mortgage History
| Date | Status | Borrower | Loan Amount |
|---|---|---|---|
| Open | Barnes Steven L | $220,000 | |
| Closed | Barnes Steven L | $145,850 | |
| Closed | Barnes Steve L | $144,400 |
Source: Public Records
Tax History Compared to Growth
Tax History
| Year | Tax Paid | Tax Assessment Tax Assessment Total Assessment is a certain percentage of the fair market value that is determined by local assessors to be the total taxable value of land and additions on the property. | Land | Improvement |
|---|---|---|---|---|
| 2025 | $2,852 | $467,373 | $219,777 | $247,596 |
| 2024 | $2,852 | $252,449 | $120,877 | $131,572 |
| 2023 | $2,987 | $266,200 | $107,645 | $158,555 |
| 2022 | $2,949 | $269,500 | $91,627 | $177,873 |
| 2021 | $2,552 | $385,000 | $97,266 | $287,734 |
| 2020 | $2,466 | $341,000 | $82,692 | $258,308 |
| 2019 | $2,377 | $307,000 | $72,730 | $234,270 |
| 2018 | $2,105 | $268,000 | $72,730 | $195,270 |
| 2017 | $2,016 | $244,000 | $72,730 | $171,270 |
| 2016 | $1,783 | $119,127 | $35,739 | $83,388 |
| 2015 | $1,686 | $110,663 | $33,022 | $77,641 |
| 2014 | $1,566 | $101,597 | $30,306 | $71,291 |
Source: Public Records
Map
Nearby Homes
- 5282 S 575 W
- 376 W 5300 S
- 5465 S 250 W
- 295 W 5650 S
- 5155 S Ridgeline Dr
- 405 W 5100 S
- 445 W 5100 S
- 548 W 5150 S
- 5226 S 200 W
- 5530 S 100 W
- 390 W 5050 S
- 5454 S 150 E Unit 39
- 246 W 5000 S
- 4931 S 300 W
- 5488 S 250 E
- 283 E 5450 S Unit 20
- 5033 S 150 E
- 5420 S 350 E Unit 43
- 125 W 4900 S Unit 9
- 1500 N Spring Creek Ln E
- 5597 S Ridgeline Dr
- 5557 S Ridgeline Dr
- 5537 S 500 W
- 5537 S Ridgeline Dr
- 5564 S 500 W
- 5584 S 500 W
- 5584 S Ridgeline Dr
- 5564 S Ridgeline Dr
- 5534 S 500 W
- 515 W 5600 S
- 5534 S Ridgeline Dr
- 519 W 5600 S
- 470 W 5600 S
- 5347 S Ridgeline Dr
- 5337 S Ridgeline Dr
- 534 W 5400 S
- 534 W 5400 S Unit 2
- 534 W 5400 S Unit 1
- 5307 S Ridgeline Dr
- 495 W 5600 S