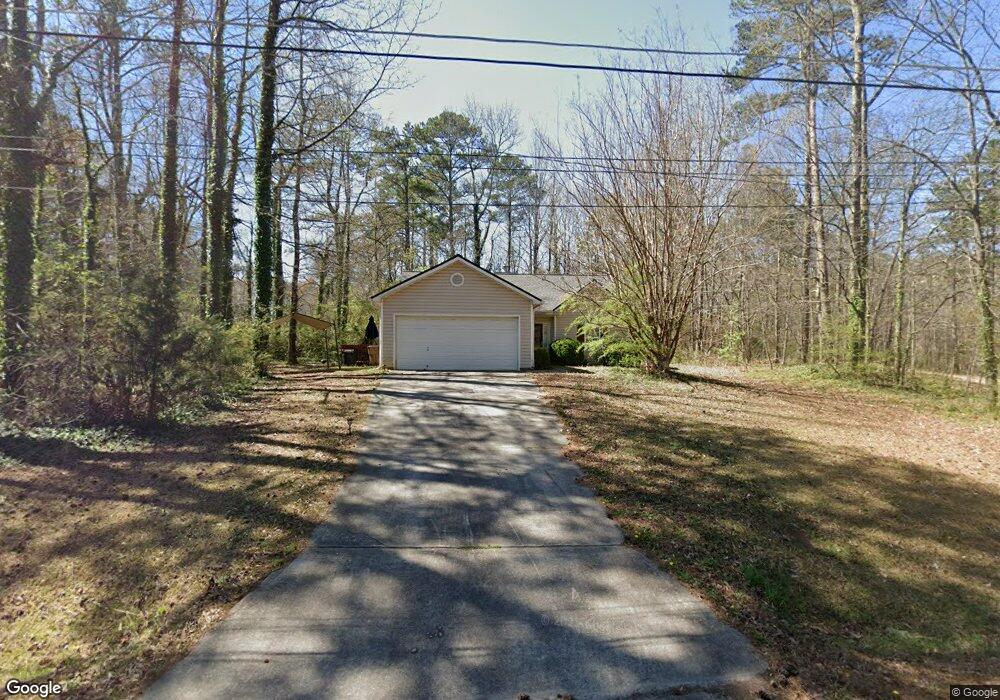
5579 Harper Blvd Morrow, GA 30260
Estimated Value: $206,000 - $257,000
3
Beds
2
Baths
1,300
Sq Ft
$174/Sq Ft
Est. Value
About This Home
This home is located at 5579 Harper Blvd, Morrow, GA 30260 and is currently estimated at $225,713, approximately $173 per square foot. 5579 Harper Blvd is a home located in Clayton County with nearby schools including Morrow Elementary School, Morrow Middle School, and Morrow High School.
Ownership History
Date
Name
Owned For
Owner Type
Purchase Details
Closed on
May 3, 2007
Sold by
Mortgage Guaranty Ins Corp
Bought by
Goodman Harold L
Current Estimated Value
Home Financials for this Owner
Home Financials are based on the most recent Mortgage that was taken out on this home.
Original Mortgage
$102,000
Outstanding Balance
$60,958
Interest Rate
6.12%
Mortgage Type
New Conventional
Estimated Equity
$164,755
Purchase Details
Closed on
Mar 7, 2007
Sold by
Jp Morgan Chase Bk
Bought by
Mortgage Guaranty Ins Corp
Home Financials for this Owner
Home Financials are based on the most recent Mortgage that was taken out on this home.
Original Mortgage
$102,000
Outstanding Balance
$60,958
Interest Rate
6.12%
Mortgage Type
New Conventional
Estimated Equity
$164,755
Purchase Details
Closed on
Dec 5, 2006
Sold by
Williams Michael
Bought by
Jp Morgan Chase Bk
Purchase Details
Closed on
Jun 21, 2002
Sold by
Williams Michael
Bought by
Williams Michael and Williams Lisa M
Home Financials for this Owner
Home Financials are based on the most recent Mortgage that was taken out on this home.
Original Mortgage
$107,100
Interest Rate
9.75%
Mortgage Type
New Conventional
Create a Home Valuation Report for This Property
The Home Valuation Report is an in-depth analysis detailing your home's value as well as a comparison with similar homes in the area
Purchase History
| Date | Buyer | Sale Price | Title Company |
|---|---|---|---|
| Goodman Harold L | $102,000 | -- | |
| Mortgage Guaranty Ins Corp | $137,500 | -- | |
| Jp Morgan Chase Bk | $120,600 | -- | |
| Williams Michael | -- | -- | |
| Williams Michael | $119,000 | -- |
Source: Public Records
Mortgage History
| Date | Status | Borrower | Loan Amount |
|---|---|---|---|
| Open | Goodman Harold L | $102,000 | |
| Previous Owner | Williams Michael | $107,100 |
Source: Public Records
Tax History
| Year | Tax Paid | Tax Assessment Tax Assessment Total Assessment is a certain percentage of the fair market value that is determined by local assessors to be the total taxable value of land and additions on the property. | Land | Improvement |
|---|---|---|---|---|
| 2025 | $3,326 | $96,840 | $4,000 | $92,840 |
| 2024 | $3,215 | $92,400 | $4,000 | $88,400 |
| 2023 | $3,121 | $86,440 | $4,000 | $82,440 |
| 2022 | $1,975 | $60,320 | $4,000 | $56,320 |
| 2021 | $1,223 | $40,960 | $4,000 | $36,960 |
| 2020 | $1,169 | $39,236 | $4,000 | $35,236 |
| 2019 | $1,056 | $36,018 | $3,600 | $32,418 |
| 2018 | $911 | $32,440 | $3,600 | $28,840 |
| 2017 | $858 | $31,076 | $3,600 | $27,476 |
| 2016 | $841 | $30,666 | $3,600 | $27,066 |
| 2015 | $839 | $0 | $0 | $0 |
| 2014 | $758 | $29,038 | $3,600 | $25,438 |
Source: Public Records
Map
Nearby Homes
- LOT 39 Herndon Blvd
- LOT 26,27,28 Herndon Blvd
- 0 Herndon Blvd Unit 7730551
- 0 Herndon Blvd Unit 7686770
- 5651 Handley Blvd
- 5347 Lacey Ave
- 5372 Bryant Blvd
- 5385 Booker t Dr
- 0 Denson Blvd Unit 1527338
- 0 Thompson Blvd
- 1829 Joy Lake Rd
- 5521 Sapphire Cir
- 2105 Forest Pkwy
- 5356 Creekview Way
- 5654 Waterford Ct
- 2272 Santa fe St Unit 21
- 5339 Creekview Ln
- 2276 Santa fe St Unit 19
- 2207 Miranda Dr
- 2316 Santa fe St Unit 5
- 5565 Harper Blvd
- 5580 Harper Blvd
- 5604 Herndon Blvd
- 5592 Harper Blvd
- 0 Herndon Blvd Unit 10699259
- 0 Herndon Blvd Unit 10625476
- 0 Herndon Blvd Unit 8624653
- 0 Herndon Blvd
- 5609 Harper Blvd
- 5561 Handley Blvd
- 5604 Harper Blvd
- 5571 Handley Blvd Unit 16 & 17
- 5571 Handley Blvd
- 5603 Handley Blvd
- 5620 Harper Blvd
- 5615 Herndon Blvd
- 5633 Harper Blvd
- 5525 Handley Blvd
- Lot 20 Handley Blvd
- 20 Handley Blvd
Your Personal Tour Guide
Ask me questions while you tour the home.