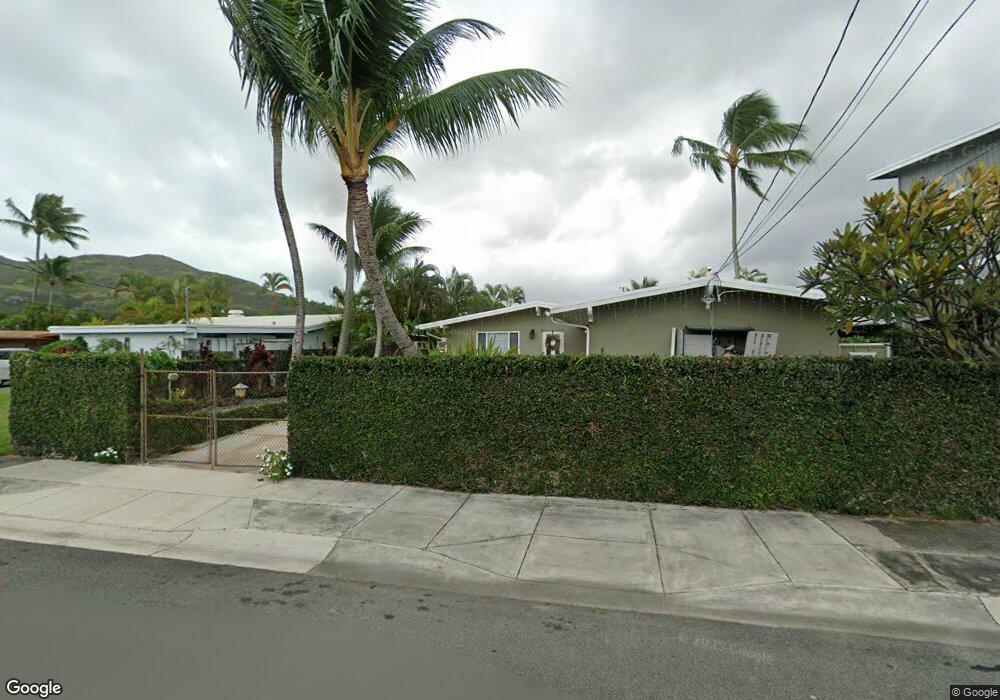
558 Paopua Loop Kailua, HI 96734
Estimated Value: $1,447,000 - $1,857,000
3
Beds
3
Baths
1,572
Sq Ft
$1,017/Sq Ft
Est. Value
About This Home
This home is located at 558 Paopua Loop, Kailua, HI 96734 and is currently estimated at $1,599,189, approximately $1,017 per square foot. 558 Paopua Loop is a home located in Honolulu County with nearby schools including Enchanted Lake Elementary School, Kailua Intermediate School, and Kailua High School.
Ownership History
Date
Name
Owned For
Owner Type
Purchase Details
Closed on
Sep 29, 2006
Sold by
Howard Scott W and Howard Wendy M
Bought by
Seeger Michael J and Seeger Ashley R
Current Estimated Value
Home Financials for this Owner
Home Financials are based on the most recent Mortgage that was taken out on this home.
Original Mortgage
$625,500
Outstanding Balance
$372,629
Interest Rate
6.43%
Mortgage Type
Unknown
Estimated Equity
$1,226,560
Purchase Details
Closed on
Mar 23, 2004
Sold by
Wayman Patrick Neal and Antony Wayman Lisa
Bought by
Howard Scott W and Howard Wendy M
Home Financials for this Owner
Home Financials are based on the most recent Mortgage that was taken out on this home.
Original Mortgage
$500,500
Interest Rate
5.64%
Mortgage Type
Unknown
Purchase Details
Closed on
Jul 24, 2001
Sold by
Kaanapu Lynne Lurette
Bought by
Wayman Patrick Neal and Antony Wayman Lisa
Home Financials for this Owner
Home Financials are based on the most recent Mortgage that was taken out on this home.
Original Mortgage
$315,250
Interest Rate
7.09%
Purchase Details
Closed on
Feb 6, 1999
Sold by
Kaanapu Lynne Lurette
Bought by
Kaanapu Lynne Lurette and The Lynne Lurette Kaanapu Trust
Create a Home Valuation Report for This Property
The Home Valuation Report is an in-depth analysis detailing your home's value as well as a comparison with similar homes in the area
Home Values in the Area
Average Home Value in this Area
Purchase History
| Date | Buyer | Sale Price | Title Company |
|---|---|---|---|
| Seeger Michael J | $797,500 | None Available | |
| Howard Scott W | $630,000 | -- | |
| Wayman Patrick Neal | $325,000 | -- | |
| Kaanapu Lynne Lurette | -- | -- |
Source: Public Records
Mortgage History
| Date | Status | Borrower | Loan Amount |
|---|---|---|---|
| Open | Seeger Michael J | $625,500 | |
| Previous Owner | Howard Scott W | $500,500 | |
| Previous Owner | Wayman Patrick Neal | $315,250 | |
| Closed | Howard Scott W | $98,000 |
Source: Public Records
Tax History Compared to Growth
Tax History
| Year | Tax Paid | Tax Assessment Tax Assessment Total Assessment is a certain percentage of the fair market value that is determined by local assessors to be the total taxable value of land and additions on the property. | Land | Improvement |
|---|---|---|---|---|
| 2025 | $4,843 | $1,441,200 | $1,242,000 | $199,200 |
| 2024 | $4,843 | $1,503,800 | $1,242,000 | $261,800 |
| 2023 | $4,073 | $1,363,600 | $1,242,000 | $121,600 |
| 2022 | $4,028 | $1,250,900 | $1,091,500 | $159,400 |
| 2021 | $3,191 | $1,011,700 | $805,400 | $206,300 |
| 2020 | $2,669 | $862,600 | $775,300 | $87,300 |
| 2019 | $2,810 | $882,800 | $828,000 | $54,800 |
| 2018 | $2,907 | $910,700 | $782,900 | $127,800 |
| 2017 | $2,760 | $868,600 | $745,200 | $123,400 |
| 2016 | $2,619 | $828,300 | $707,600 | $120,700 |
| 2015 | $2,288 | $733,800 | $661,000 | $72,800 |
| 2014 | $2,063 | $738,700 | $600,900 | $137,800 |
Source: Public Records
Map
Nearby Homes
- 519 Wanaao Rd
- 279 Kakahiaka St
- 757 Akumu St
- 976 Kalawai Place Unit 4B
- 1015 Aoloa Place Unit 437
- 1015 Aoloa Place Unit 218
- 411 Kaelepulu Dr Unit E
- 507 Kawailoa Rd Unit B
- 333 Aoloa St Unit 325
- 358 Kaelepulu Dr Unit 702
- 358D Kaelepulu Dr Unit 704
- 391 Kaelepulu Dr Unit A
- 389 Kaelepulu Dr Unit 1501
- 1020 Aoloa Place Unit 210A
- 1020 Aoloa Place Unit 110A
- 1020 Aoloa Place Unit 311B
- 481 Kawailoa Rd Unit B
- 350 Kaelepulu Dr Unit 401
- 348H Kaelepulu Dr Unit 608
- 465 Kawailoa Rd
- 554 Paopua Loop
- 564 Paopua Loop
- 584 Pamaele St
- 550 Paopua Loop
- 572 Paopua Loop
- 586 Pamaele St
- 528 Paopua Place
- 578 Pamaele St
- 527 Paopua Place
- 578 Paopua Loop
- 588 Pamaele St
- 565 Paopua Loop
- 545 Wanaao Rd
- 551 Wanaao Rd
- 510 Paopua Place
- 586 Paopua Loop
- 557 Wanaao Rd
- 557 Wanaao Rd Unit A
- 523 Paopua Place
- 531 Wanaao Rd