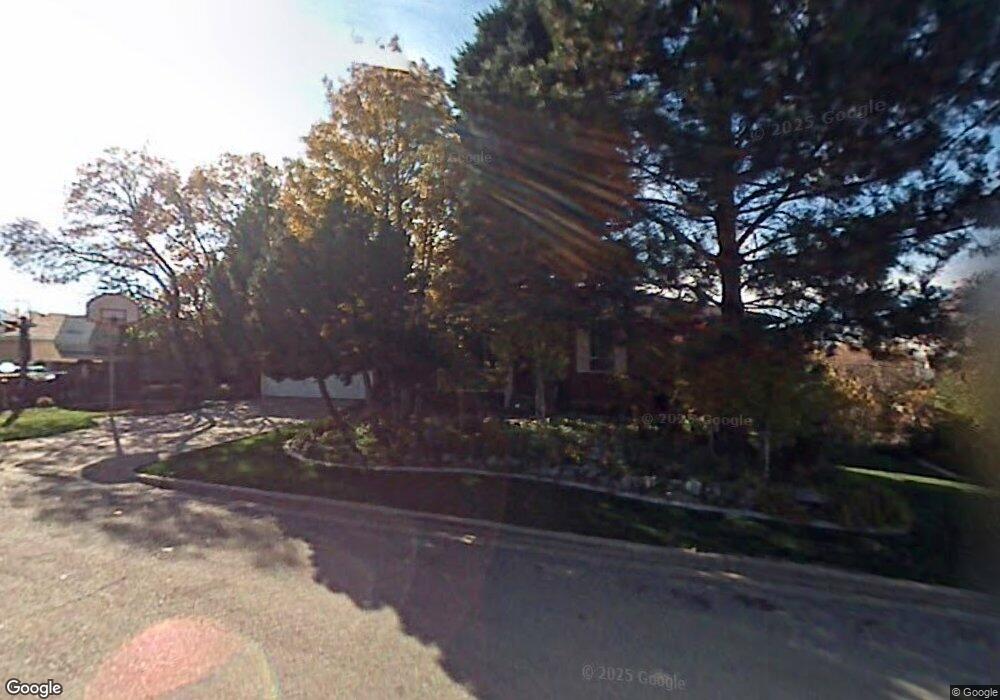
558 S Grand Oaks Dr Fruit Heights, UT 84037
Estimated Value: $610,000 - $643,635
5
Beds
3
Baths
3,086
Sq Ft
$202/Sq Ft
Est. Value
About This Home
This home is located at 558 S Grand Oaks Dr, Fruit Heights, UT 84037 and is currently estimated at $623,909, approximately $202 per square foot. 558 S Grand Oaks Dr is a home located in Davis County with nearby schools including Morgan Elementary School, Fairfield Junior High School, and Davis High School.
Ownership History
Date
Name
Owned For
Owner Type
Purchase Details
Closed on
Aug 6, 2025
Sold by
Maddox Samuel Lavern and Sam And Jenny Maddox Family Trust
Bought by
Sam And Jenny Maddox Family Trust and Maddox
Current Estimated Value
Purchase Details
Closed on
Jun 10, 2025
Sold by
Maddox Samuel and Maddox Jennifer
Bought by
Sam And Jenny Maddox Family Trust and Maddox
Purchase Details
Closed on
Feb 23, 2017
Sold by
Caudill Jeff
Bought by
Maddox Samuel and Maddox Jennifer
Purchase Details
Closed on
Nov 30, 2010
Sold by
Caudill Dennis H and Caudill Linda B
Bought by
Caudill Jeff
Home Financials for this Owner
Home Financials are based on the most recent Mortgage that was taken out on this home.
Original Mortgage
$217,861
Interest Rate
4.25%
Mortgage Type
FHA
Create a Home Valuation Report for This Property
The Home Valuation Report is an in-depth analysis detailing your home's value as well as a comparison with similar homes in the area
Home Values in the Area
Average Home Value in this Area
Purchase History
| Date | Buyer | Sale Price | Title Company |
|---|---|---|---|
| Sam And Jenny Maddox Family Trust | -- | Us Title | |
| Sam And Jenny Maddox Family Trust | -- | Us Title | |
| Sam And Jenny Maddox Family Trust | -- | Us Title | |
| Maddox Samuel | -- | Backman Title | |
| Caudill Jeff | -- | Atlas Title Murray |
Source: Public Records
Mortgage History
| Date | Status | Borrower | Loan Amount |
|---|---|---|---|
| Previous Owner | Caudill Jeff | $217,861 |
Source: Public Records
Tax History Compared to Growth
Tax History
| Year | Tax Paid | Tax Assessment Tax Assessment Total Assessment is a certain percentage of the fair market value that is determined by local assessors to be the total taxable value of land and additions on the property. | Land | Improvement |
|---|---|---|---|---|
| 2024 | $2,936 | $300,850 | $196,503 | $104,347 |
| 2023 | $2,822 | $524,000 | $237,234 | $286,766 |
| 2022 | $3,087 | $312,950 | $132,279 | $180,671 |
| 2021 | $2,767 | $424,000 | $194,239 | $229,761 |
| 2020 | $2,493 | $370,000 | $162,498 | $207,502 |
| 2019 | $2,511 | $368,000 | $154,865 | $213,135 |
| 2018 | $2,381 | $344,000 | $149,836 | $194,164 |
| 2016 | $1,950 | $146,795 | $69,328 | $77,467 |
| 2015 | $1,890 | $135,300 | $69,328 | $65,972 |
| 2014 | $1,912 | $145,005 | $68,317 | $76,688 |
| 2013 | -- | $127,407 | $45,038 | $82,369 |
Source: Public Records
Map
Nearby Homes
- 399 Stirling Dr E
- 1351 E 400 S
- 362 Glen Cir
- 358 S Eastoaks Dr
- 1644 E Old Lake Ln
- 1419 E Heights Way Unit 15
- 570 S 1800 E
- 1691 Harvey Rd
- 1543 Mirabella Way Unit 21
- 1206 E 986 S Unit 31
- 1053 Sage Ln
- 947 E Green Rd
- 1145 Creek View Dr
- 998 E Country Rd
- 1043 S Oxford Cir
- 1425 250 N
- 1779 250 N Unit 29-R
- 1730 250 N Unit 23-R
- 1616 250 N Unit 26-R
- 2076 Summerwood Dr
- 558 Grand Oaks Dr
- 582 Grand Oaks Dr
- 540 S Grand Oaks Dr
- 549 S 1350 E
- 536 Grand Oaks Dr
- 569 Grand Oaks Dr
- 547 S 1350 E
- 537 Grand Oaks Dr
- 551 S 1350 E
- 537 S Grand Oaks Dr
- 604 Grand Oaks Dr
- 1388 Nicholls Rd
- 604 S Grand Oaks Dr
- 1370 Nicholls Rd
- 593 Grand Oaks Dr
- 593 S Grand Oaks Dr
- 513 Grand Oaks Dr
- 1436 Waterfall Way
- 1436 E Waterfall Way
- 1360 Nicholls Rd