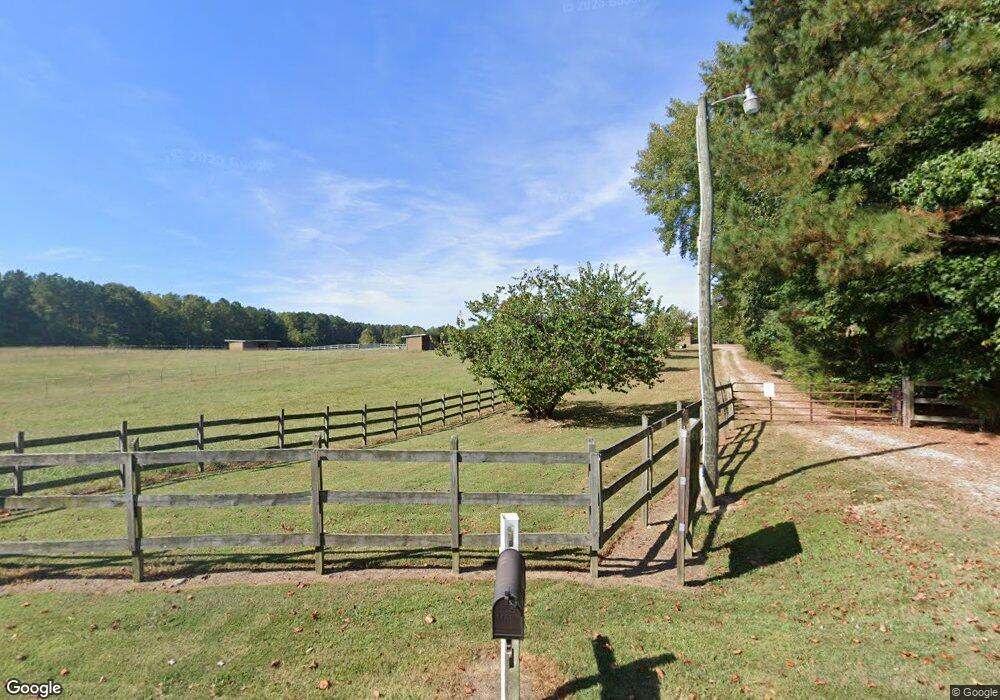
558 T Model Jones Rd Castalia, NC 27816
Estimated Value: $577,000 - $707,510
2
Beds
2
Baths
1,146
Sq Ft
$570/Sq Ft
Est. Value
About This Home
This home is located at 558 T Model Jones Rd, Castalia, NC 27816 and is currently estimated at $653,628, approximately $570 per square foot. 558 T Model Jones Rd is a home located in Franklin County with nearby schools including Edward Best Elementary School and Louisburg High School.
Ownership History
Date
Name
Owned For
Owner Type
Purchase Details
Closed on
Aug 23, 2019
Sold by
Martin Douglas K and Martin Elizabeth F
Bought by
Vitus Farm Llc
Current Estimated Value
Purchase Details
Closed on
Aug 18, 2017
Sold by
Vitus Enterprises Llc
Bought by
Martin Douglas K and Martin Elizabeth F
Home Financials for this Owner
Home Financials are based on the most recent Mortgage that was taken out on this home.
Original Mortgage
$200,000
Interest Rate
3.96%
Mortgage Type
Future Advance Clause Open End Mortgage
Purchase Details
Closed on
Sep 6, 2011
Sold by
Briggs Joel L
Bought by
Vitus Enterprises Llc
Home Financials for this Owner
Home Financials are based on the most recent Mortgage that was taken out on this home.
Original Mortgage
$187,000
Interest Rate
4.55%
Mortgage Type
Unknown
Purchase Details
Closed on
Feb 14, 2006
Sold by
Ball George F and Ball Hilda S
Bought by
Briggs Joel L
Create a Home Valuation Report for This Property
The Home Valuation Report is an in-depth analysis detailing your home's value as well as a comparison with similar homes in the area
Home Values in the Area
Average Home Value in this Area
Purchase History
| Date | Buyer | Sale Price | Title Company |
|---|---|---|---|
| Vitus Farm Llc | -- | None Available | |
| Martin Douglas K | $360,000 | Attorney | |
| Vitus Enterprises Llc | $306,000 | None Available | |
| Briggs Joel L | $212,500 | None Available |
Source: Public Records
Mortgage History
| Date | Status | Borrower | Loan Amount |
|---|---|---|---|
| Previous Owner | Martin Douglas K | $200,000 | |
| Previous Owner | Vitus Enterprises Llc | $187,000 |
Source: Public Records
Tax History Compared to Growth
Tax History
| Year | Tax Paid | Tax Assessment Tax Assessment Total Assessment is a certain percentage of the fair market value that is determined by local assessors to be the total taxable value of land and additions on the property. | Land | Improvement |
|---|---|---|---|---|
| 2025 | $4,293 | $669,230 | $378,070 | $291,160 |
| 2024 | $4,293 | $669,230 | $378,070 | $291,160 |
| 2023 | $2,789 | $296,000 | $144,120 | $151,880 |
| 2022 | $2,720 | $296,000 | $144,120 | $151,880 |
| 2021 | $2,712 | $296,000 | $144,120 | $151,880 |
| 2020 | $2,729 | $296,000 | $144,120 | $151,880 |
| 2019 | $2,682 | $296,000 | $144,120 | $151,880 |
| 2018 | $2,677 | $296,000 | $144,120 | $151,880 |
| 2017 | $2,263 | $226,146 | $125,890 | $100,256 |
| 2016 | $2,341 | $226,146 | $125,890 | $100,256 |
| 2015 | $2,374 | $229,376 | $129,120 | $100,256 |
| 2014 | $2,228 | $229,376 | $129,120 | $100,256 |
Source: Public Records
Map
Nearby Homes
- 317 Brewer Rd
- 721 N Carolina 58
- 15 Gina Lee Terrace
- 1056 N Carolina 58
- 4.29 Acres Leonard Rd
- 9.56 Acres Leonard Rd
- 2150 N Carolina 58
- 290 Collie Rd
- 0 Stallings Mill Rd
- 00 Stallings Mill Rd Unit LotWP007
- 00 Stallings Mill Rd Unit LotWP005
- 00 Stallings Mill Rd Unit LotWP004
- 00 Stallings Mill Rd Unit LotWP003
- 0 Shortleaf Dr Unit 10119597
- 0 Poker Shake Ln Unit 10103109
- 0 Poker Shake Ln Unit 10103058
- 348 Raymond Tharrington Rd
- 0 Lancaster Store Rd
- 691 N Carolina 58
- DUPONT Plan at Lancaster Farm
- 540 T Model Jones Rd
- 529 T Model Jones Rd
- 602 T Model Jones Rd
- 45 Amigo Ln
- 464 T Model Jones Rd
- 60 Amigo Ln
- 50 Amigo Ln
- 206 George Leonard Way
- 379 T Model Jones Rd
- 508 Fishing Rock Rd
- 910 Fishing Rock Rd
- 175 George Leonard Way
- 76 George Leonard Way
- 0 T-Model Jones Rd
- 394 King Rd
- 216 King Rd
- 394 King Rd
- 394 King Rd Unit None
- 284 T Model Jones Rd