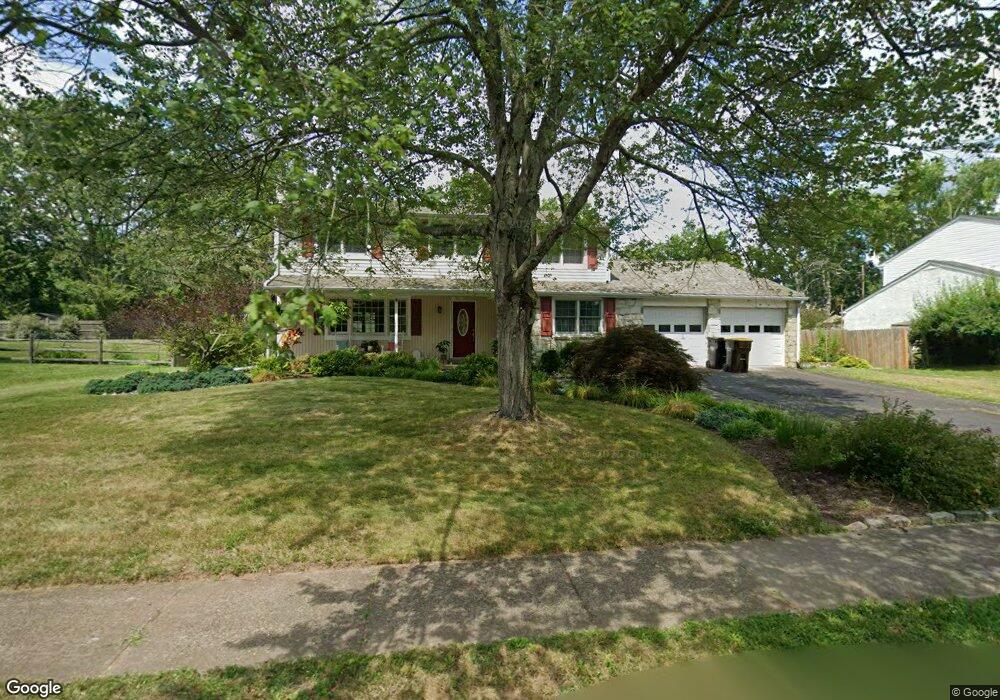
558 Valley Brook Dr Lansdale, PA 19446
Estimated Value: $510,842 - $567,000
5
Beds
3
Baths
2,145
Sq Ft
$248/Sq Ft
Est. Value
About This Home
This home is located at 558 Valley Brook Dr, Lansdale, PA 19446 and is currently estimated at $532,461, approximately $248 per square foot. 558 Valley Brook Dr is a home located in Montgomery County with nearby schools including Knapp Elementary School, Penndale Middle School, and North Penn Senior High School.
Ownership History
Date
Name
Owned For
Owner Type
Purchase Details
Closed on
Oct 25, 2006
Sold by
Cartus Financial Corp
Bought by
Crane David A and Vankova Marketa
Current Estimated Value
Home Financials for this Owner
Home Financials are based on the most recent Mortgage that was taken out on this home.
Original Mortgage
$249,600
Outstanding Balance
$148,882
Interest Rate
6.36%
Estimated Equity
$383,579
Purchase Details
Closed on
May 8, 2006
Sold by
Papp Bonnie Galligan and Papp Michael Allan
Bought by
Cartus Financial Corp
Home Financials for this Owner
Home Financials are based on the most recent Mortgage that was taken out on this home.
Original Mortgage
$249,600
Interest Rate
6.36%
Purchase Details
Closed on
Oct 10, 1997
Sold by
Vanmatre Mary E
Bought by
Papp Michael Allan and Papp Bonnie Galligan
Create a Home Valuation Report for This Property
The Home Valuation Report is an in-depth analysis detailing your home's value as well as a comparison with similar homes in the area
Home Values in the Area
Average Home Value in this Area
Purchase History
| Date | Buyer | Sale Price | Title Company |
|---|---|---|---|
| Crane David A | $312,000 | None Available | |
| Cartus Financial Corp | $358,500 | None Available | |
| Papp Michael Allan | $164,000 | -- |
Source: Public Records
Mortgage History
| Date | Status | Borrower | Loan Amount |
|---|---|---|---|
| Open | Crane David A | $249,600 | |
| Previous Owner | Cartus Financial Corp | $249,600 |
Source: Public Records
Tax History Compared to Growth
Tax History
| Year | Tax Paid | Tax Assessment Tax Assessment Total Assessment is a certain percentage of the fair market value that is determined by local assessors to be the total taxable value of land and additions on the property. | Land | Improvement |
|---|---|---|---|---|
| 2025 | $6,171 | $146,700 | $44,140 | $102,560 |
| 2024 | $6,171 | $146,700 | $44,140 | $102,560 |
| 2023 | $5,773 | $146,700 | $44,140 | $102,560 |
| 2022 | $5,589 | $146,700 | $44,140 | $102,560 |
| 2021 | $5,361 | $146,700 | $44,140 | $102,560 |
| 2020 | $5,200 | $146,700 | $44,140 | $102,560 |
| 2019 | $2,731 | $146,700 | $44,140 | $102,560 |
| 2018 | $1,371 | $146,700 | $44,140 | $102,560 |
| 2017 | $4,773 | $146,700 | $44,140 | $102,560 |
| 2016 | $4,716 | $146,700 | $44,140 | $102,560 |
| 2015 | $4,376 | $146,700 | $44,140 | $102,560 |
| 2014 | $4,376 | $146,700 | $44,140 | $102,560 |
Source: Public Records
Map
Nearby Homes
- 825 Monticello Place
- 502 Williamsburg Rd
- 873 Lombardy Dr
- 964 Knapp Rd
- 323 Edgewood Ave
- 3103 Hemmingway Dr
- 220 Pennbrook Ave
- 1014 Lansdale Ave
- 3406 Elizabeths Ct
- 316 Pennbrook Ave
- 1114 W Thomas Rd
- 1506 Naomis Ct
- 1103 Lansdale Ave
- 111 Country Ln
- 235 E 2nd St
- 2 N Line St
- 1107 Lansdale Ave
- 200 E 5th St
- 130 E 5th St
- 19 Wexford Dr
- 568 Valley Brook Dr
- 548 Valley Brook Dr
- 557 Hillside Dr
- 547 Hillside Dr
- 567 Hillside Dr
- 578 Valley Brook Dr
- 557 Valley Brook Dr
- 567 Valley Brook Dr
- 537 Hillside Dr
- 547 Valley Brook Dr
- 577 Hillside Dr
- 577 Valley Brook Dr
- 558 Hillside Dr
- 568 Hillside Dr
- 621 Salem Dr
- 548 Hillside Dr
- 611 Salem Dr
- 631 Salem Dr
- 578 Hillside Dr
- 601 Salem Dr