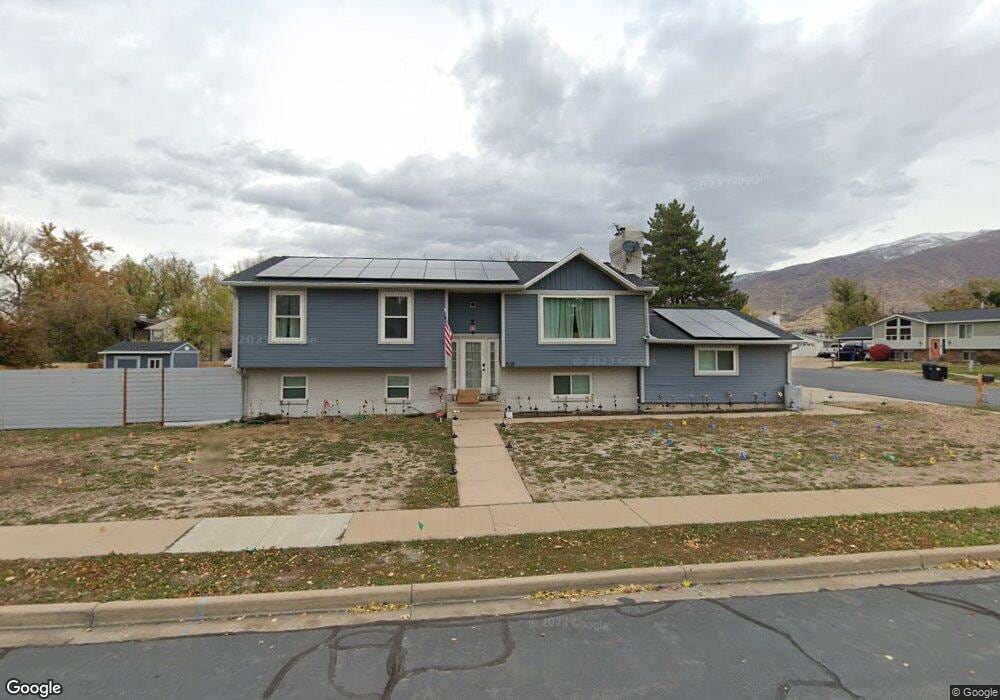
558 W 2125 N West Bountiful, UT 84087
Estimated Value: $512,000 - $603,000
4
Beds
3
Baths
2,364
Sq Ft
$232/Sq Ft
Est. Value
About This Home
This home is located at 558 W 2125 N, West Bountiful, UT 84087 and is currently estimated at $548,335, approximately $231 per square foot. 558 W 2125 N is a home located in Davis County with nearby schools including West Bountiful Elementary School, Bountiful Junior High School, and Viewmont High School.
Ownership History
Date
Name
Owned For
Owner Type
Purchase Details
Closed on
Aug 24, 2018
Sold by
Lou Michael D and Lou Mui N
Bought by
Trader Greg W and Trader Hannah C
Current Estimated Value
Home Financials for this Owner
Home Financials are based on the most recent Mortgage that was taken out on this home.
Original Mortgage
$299,475
Outstanding Balance
$264,200
Interest Rate
5.25%
Mortgage Type
FHA
Estimated Equity
$284,135
Purchase Details
Closed on
Mar 1, 2016
Sold by
Lou Michael D
Bought by
Lou Michael D and Lou Mui N
Purchase Details
Closed on
Aug 22, 2002
Sold by
Washington Mutual Bank Fa
Bought by
Vandang Dung and Lou Lay
Home Financials for this Owner
Home Financials are based on the most recent Mortgage that was taken out on this home.
Original Mortgage
$128,250
Interest Rate
6.52%
Purchase Details
Closed on
May 25, 2000
Sold by
Ebert Edwin and Ebert Freda
Bought by
White David G
Home Financials for this Owner
Home Financials are based on the most recent Mortgage that was taken out on this home.
Original Mortgage
$122,673
Interest Rate
8.99%
Create a Home Valuation Report for This Property
The Home Valuation Report is an in-depth analysis detailing your home's value as well as a comparison with similar homes in the area
Home Values in the Area
Average Home Value in this Area
Purchase History
| Date | Buyer | Sale Price | Title Company |
|---|---|---|---|
| Trader Greg W | -- | Us Title | |
| Lou Michael D | -- | Northwest Title | |
| Lou Michael D | -- | Northwest Title | |
| Vandang Dung | -- | First American Title Co | |
| White David G | -- | United Title Services |
Source: Public Records
Mortgage History
| Date | Status | Borrower | Loan Amount |
|---|---|---|---|
| Open | Trader Greg W | $299,475 | |
| Previous Owner | Vandang Dung | $128,250 | |
| Previous Owner | White David G | $122,673 |
Source: Public Records
Tax History
| Year | Tax Paid | Tax Assessment Tax Assessment Total Assessment is a certain percentage of the fair market value that is determined by local assessors to be the total taxable value of land and additions on the property. | Land | Improvement |
|---|---|---|---|---|
| 2025 | $234 | $261,800 | $133,672 | $128,128 |
| 2024 | $205 | $251,900 | $109,941 | $141,959 |
| 2023 | $176 | $443,000 | $207,844 | $235,156 |
| 2022 | $164 | $249,150 | $99,802 | $149,348 |
| 2021 | $155 | $351,000 | $134,836 | $216,164 |
| 2020 | $145 | $309,000 | $124,950 | $184,050 |
| 2019 | $128 | $297,000 | $125,947 | $171,053 |
| 2018 | $2,041 | $276,000 | $125,933 | $150,067 |
| 2016 | $1,726 | $126,610 | $33,189 | $93,421 |
| 2015 | $1,633 | $113,795 | $33,189 | $80,606 |
| 2014 | $1,685 | $121,099 | $33,189 | $87,910 |
| 2013 | -- | $105,891 | $29,974 | $75,917 |
Source: Public Records
Map
Nearby Homes
- 1767 N 600 W
- 722 W 2250 N
- 680 W 2350 N
- 287 S 680 W Unit 9
- 635 W 550 S
- 324 S 600 W
- 789 W 1950 N
- 2339 N 800 W
- 2257 N 830 W
- 1520 N 550 W
- 328 W Pages Ln
- 204 Lyman Ln
- 330 W Paradiso Ln
- 147 N 360 W Unit 21
- 954 Ruby Way
- 988 W 1950 N Unit 134
- 88 W 50 S Unit A4
- 88 W 50 S Unit C-3
- 88 W 50 S Unit B5
- 951 Centerville Commons Way
Your Personal Tour Guide
Ask me questions while you tour the home.