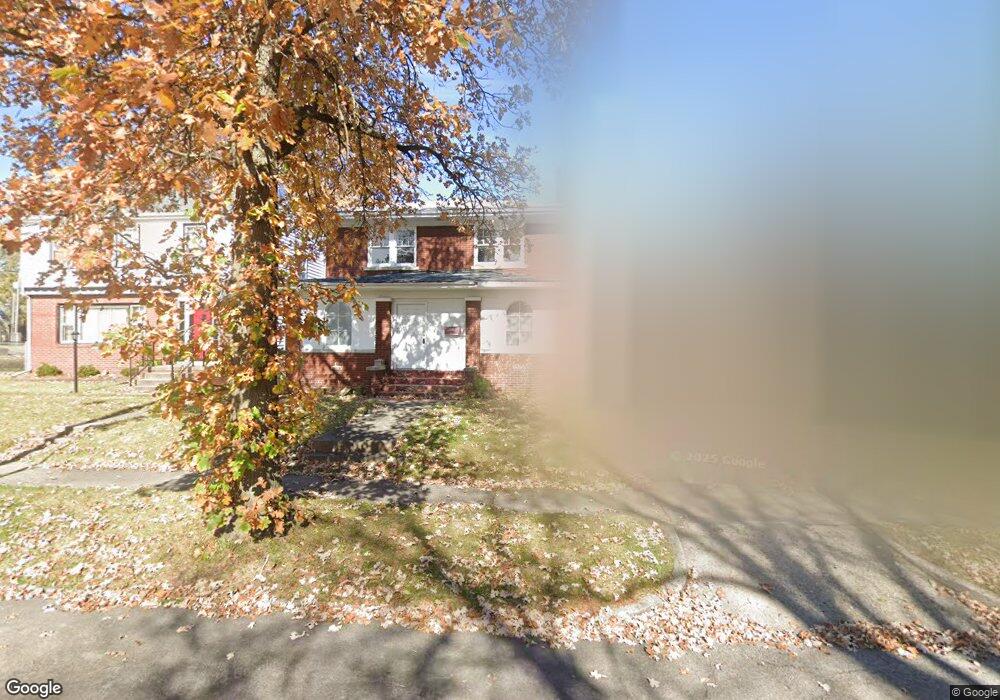
558 W Macon St Decatur, IL 62522
Near West NeighborhoodEstimated Value: $49,000 - $82,000
4
Beds
3
Baths
3,122
Sq Ft
$20/Sq Ft
Est. Value
About This Home
This home is located at 558 W Macon St, Decatur, IL 62522 and is currently estimated at $61,146, approximately $19 per square foot. 558 W Macon St is a home located in Macon County with nearby schools including Dennis Lab School, St. Patrick School, and Teen Challenge-Home For Girls.
Ownership History
Date
Name
Owned For
Owner Type
Purchase Details
Closed on
Mar 17, 2021
Sold by
Macon County
Bought by
Williams Chanae and Williams David
Current Estimated Value
Purchase Details
Closed on
Oct 15, 2020
Sold by
Macon County Clerk
Bought by
Macon County
Purchase Details
Closed on
Jun 12, 2020
Sold by
Vista Securities Inc
Bought by
Realbanc I Inc
Purchase Details
Closed on
Sep 20, 2007
Sold by
Bank Of New York
Bought by
Flowers Nicole S and Small Michael Damian
Purchase Details
Closed on
Mar 27, 2007
Sold by
Mcconnell Richard L and Mcconnell Richard Lynn
Bought by
Bank Of New York
Purchase Details
Closed on
Apr 22, 2005
Sold by
Good Hugh and Good Cynthia
Bought by
Mcconnell Richard L and Mcconnell Janette L
Home Financials for this Owner
Home Financials are based on the most recent Mortgage that was taken out on this home.
Original Mortgage
$62,910
Interest Rate
10.35%
Mortgage Type
Adjustable Rate Mortgage/ARM
Purchase Details
Closed on
Dec 1, 1997
Create a Home Valuation Report for This Property
The Home Valuation Report is an in-depth analysis detailing your home's value as well as a comparison with similar homes in the area
Home Values in the Area
Average Home Value in this Area
Purchase History
| Date | Buyer | Sale Price | Title Company |
|---|---|---|---|
| Williams Chanae | -- | None Available | |
| Macon County | -- | None Available | |
| Realbanc I Inc | -- | None Available | |
| Flowers Nicole S | $8,750 | None Available | |
| Bank Of New York | -- | None Available | |
| Mcconnell Richard L | $70,000 | None Available | |
| -- | $10,000 | -- |
Source: Public Records
Mortgage History
| Date | Status | Borrower | Loan Amount |
|---|---|---|---|
| Previous Owner | Mcconnell Richard L | $62,910 |
Source: Public Records
Tax History Compared to Growth
Tax History
| Year | Tax Paid | Tax Assessment Tax Assessment Total Assessment is a certain percentage of the fair market value that is determined by local assessors to be the total taxable value of land and additions on the property. | Land | Improvement |
|---|---|---|---|---|
| 2024 | $1,079 | $11,147 | $1,922 | $9,225 |
| 2023 | $1,070 | $10,752 | $1,854 | $8,898 |
| 2022 | $0 | $110 | $55 | $55 |
| 2021 | $0 | $102 | $51 | $51 |
| 2020 | $0 | $0 | $0 | $0 |
| 2019 | $2,403 | $22,602 | $1,309 | $21,293 |
| 2018 | $2,383 | $22,677 | $1,313 | $21,364 |
| 2017 | $2,439 | $23,282 | $1,348 | $21,934 |
| 2016 | $2,485 | $23,520 | $1,362 | $22,158 |
| 2015 | $2,362 | $23,104 | $1,338 | $21,766 |
| 2014 | $2,193 | $22,875 | $1,325 | $21,550 |
| 2013 | $2,266 | $23,734 | $1,375 | $22,359 |
Source: Public Records
Map
Nearby Homes
- 612 W Macon St
- 657 W Wood St
- 450 W Macon St
- 617 W Decatur St
- 440 W Macon St
- 437 Powers Ln
- 441 S Seigel St
- 628 W Forest Ave
- 717 W Prairie Ave Unit 2
- 452 W Prairie Ave
- 442 W Prairie Ave
- 320 W Main St
- 609 W William St
- 233 N Edward St
- 899 W Main St
- 366 W Prairie Ave
- 530 Powers Ln
- 254 N Pine St
- 281 W Prairie Ave
- 422 W William St