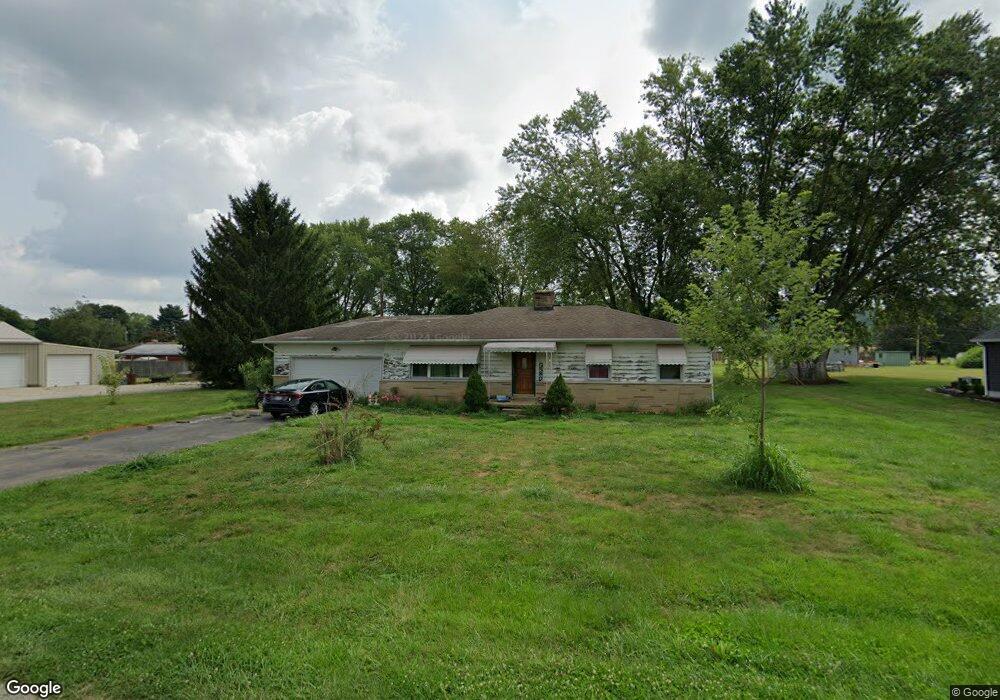
5580 Fairfield St SE Lancaster, OH 43130
Estimated Value: $227,000 - $295,372
3
Beds
2
Baths
1,232
Sq Ft
$214/Sq Ft
Est. Value
About This Home
This home is located at 5580 Fairfield St SE, Lancaster, OH 43130 and is currently estimated at $263,343, approximately $213 per square foot. 5580 Fairfield St SE is a home located in Fairfield County with nearby schools including Berne Union Elementary School and Berne Union High School.
Ownership History
Date
Name
Owned For
Owner Type
Purchase Details
Closed on
Feb 18, 2021
Sold by
Gloyd Kristy M
Bought by
Gloyd Steven G
Current Estimated Value
Home Financials for this Owner
Home Financials are based on the most recent Mortgage that was taken out on this home.
Original Mortgage
$46,750
Outstanding Balance
$30,515
Interest Rate
2.9%
Mortgage Type
Credit Line Revolving
Estimated Equity
$232,828
Purchase Details
Closed on
Apr 30, 2014
Sold by
Bay Betty M and Bay Betty
Bought by
Gloyd Kristy M and Gloyd Steven G
Home Financials for this Owner
Home Financials are based on the most recent Mortgage that was taken out on this home.
Original Mortgage
$49,094
Interest Rate
4.25%
Mortgage Type
FHA
Purchase Details
Closed on
Mar 15, 2006
Sold by
Bay Lewis E and Bay Betty
Bought by
Bay Lewis E and Bay Betty M
Create a Home Valuation Report for This Property
The Home Valuation Report is an in-depth analysis detailing your home's value as well as a comparison with similar homes in the area
Home Values in the Area
Average Home Value in this Area
Purchase History
| Date | Buyer | Sale Price | Title Company |
|---|---|---|---|
| Gloyd Steven G | -- | Landsel Title | |
| Gloyd Kristy M | $50,000 | Arrow Title Agency | |
| Bay Lewis E | -- | None Available |
Source: Public Records
Mortgage History
| Date | Status | Borrower | Loan Amount |
|---|---|---|---|
| Open | Gloyd Steven G | $46,750 | |
| Closed | Gloyd Kristy M | $49,094 |
Source: Public Records
Tax History Compared to Growth
Tax History
| Year | Tax Paid | Tax Assessment Tax Assessment Total Assessment is a certain percentage of the fair market value that is determined by local assessors to be the total taxable value of land and additions on the property. | Land | Improvement |
|---|---|---|---|---|
| 2024 | $4,609 | $63,830 | $12,600 | $51,230 |
| 2023 | $2,191 | $63,830 | $12,600 | $51,230 |
| 2022 | $2,189 | $63,830 | $12,600 | $51,230 |
| 2021 | $1,744 | $46,380 | $9,600 | $36,780 |
| 2020 | $1,750 | $46,380 | $9,600 | $36,780 |
| 2019 | $1,755 | $46,380 | $9,600 | $36,780 |
| 2018 | $1,266 | $35,350 | $9,600 | $25,750 |
| 2017 | $1,182 | $34,150 | $8,400 | $25,750 |
| 2016 | $1,162 | $34,150 | $8,400 | $25,750 |
| 2015 | $1,142 | $33,000 | $8,400 | $24,600 |
| 2014 | $794 | $33,000 | $8,400 | $24,600 |
| 2013 | $794 | $33,000 | $8,400 | $24,600 |
Source: Public Records
Map
Nearby Homes
- 4155 Savage Hill Rd SE
- 1531 Tarkiln Rd SE
- 1121 Tarkiln Rd SE Unit 109
- 509 Tarkiln Rd SE
- 820 Pump Station Rd SE
- 284 Blue Valley Rd SE
- 7280 Sugar Grove Rd SE
- 513 Ross Rd SE
- 4300 Bis Rd SW
- 0 Wilson's Ln SE Unit Lot2
- 0 Wilson's Ln SE Unit Lot3
- 0 Wilson's Ln SE Unit Lot1
- 3500 Bauman Hill Rd SE
- 25779 Bailey Rd
- 3489 Country Club Rd SW
- 5440 Borah Hill Rd
- 3597 Country Club Rd SW
- 3665 Country Club Rd SW
- 3629 Country Club Rd SW
- 25345 Buena Vista Rd
- 5606 Fairfield St SE
- 5575 Fairfield St SE
- 5585 Fairfield St SE
- 5615 Fairfield St SE
- 2466 Berne St SE
- 2455 Blue Valley Rd SE
- 2475 Blue Valley Rd SE
- 5641 Fairfield St SE
- 2486 Berne St SE
- 2495 Blue Valley Rd SE
- 2425 Blue Valley Rd SE
- 2465 Berne St SE
- 5661 Fairfield St SE
- 2395 Blue Valley Rd SE
- 5579 Old Logan Rd SE
- 5605 Old Logan Rd SE
- 5560 Mason Dr SE
- 5620 Mason Dr SE
- 5555 Old Logan Rd SE
- 5686 Fairfield St SE