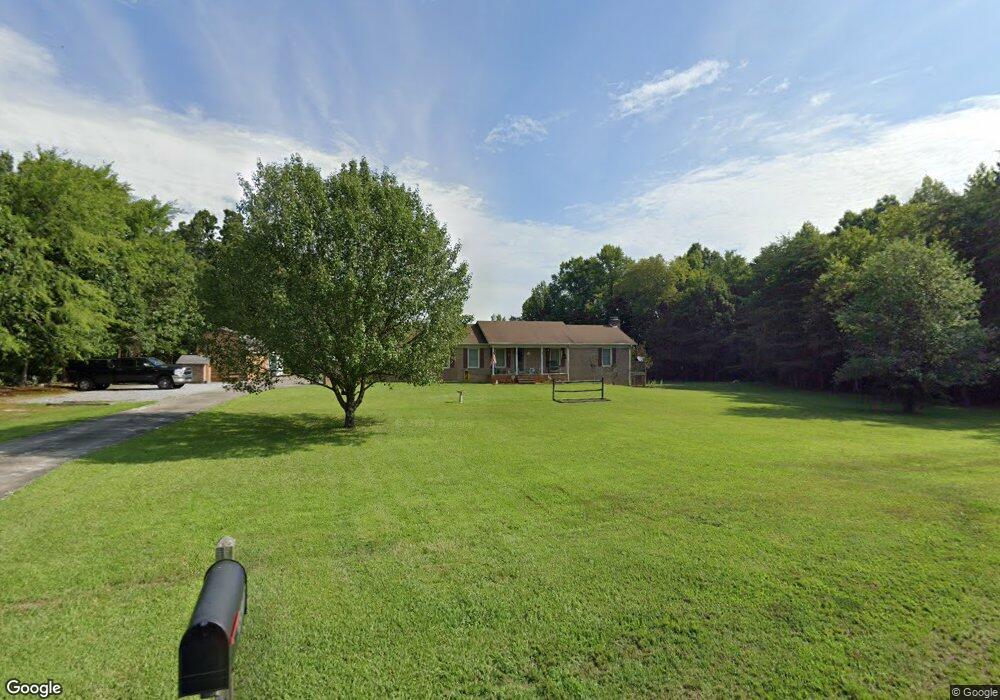
5580 Fish Pond Rd Salisbury, NC 28146
Estimated Value: $235,000 - $301,000
Studio
2
Baths
1,180
Sq Ft
$223/Sq Ft
Est. Value
About This Home
This home is located at 5580 Fish Pond Rd, Salisbury, NC 28146 and is currently estimated at $263,722, approximately $223 per square foot. 5580 Fish Pond Rd is a home located in Rowan County with nearby schools including Granite Quarry Elementary School, Charles C Erwin Middle School, and East Rowan High School.
Ownership History
Date
Name
Owned For
Owner Type
Purchase Details
Closed on
Jan 18, 2023
Sold by
Beinkampen John P
Bought by
Beinkampen David Karl and Beinkampen Roncie Roberta
Current Estimated Value
Purchase Details
Closed on
Feb 21, 2022
Sold by
Karl Beinkampen David and Karl Roberta Roncie
Bought by
Beinkampen John P and Beinkampen David A
Purchase Details
Closed on
Sep 3, 1998
Bought by
Beinkampen David Karl and Beinkampen F
Create a Home Valuation Report for This Property
The Home Valuation Report is an in-depth analysis detailing your home's value as well as a comparison with similar homes in the area
Purchase History
| Date | Buyer | Sale Price | Title Company |
|---|---|---|---|
| Beinkampen David Karl | -- | -- | |
| Beinkampen John P | -- | None Listed On Document | |
| Beinkampen David Karl | $100,000 | -- |
Source: Public Records
Tax History
| Year | Tax Paid | Tax Assessment Tax Assessment Total Assessment is a certain percentage of the fair market value that is determined by local assessors to be the total taxable value of land and additions on the property. | Land | Improvement |
|---|---|---|---|---|
| 2025 | $1,361 | $214,353 | $60,200 | $154,153 |
| 2024 | $1,361 | $214,353 | $60,200 | $154,153 |
| 2023 | $1,361 | $214,353 | $60,200 | $154,153 |
| 2022 | $1,051 | $147,466 | $45,600 | $101,866 |
| 2021 | $1,021 | $147,466 | $45,600 | $101,866 |
| 2020 | $1,021 | $147,466 | $45,600 | $101,866 |
| 2019 | $1,021 | $147,466 | $45,600 | $101,866 |
| 2018 | $955 | $138,938 | $45,600 | $93,338 |
| 2017 | $955 | $138,938 | $45,600 | $93,338 |
| 2016 | $955 | $138,938 | $45,600 | $93,338 |
| 2015 | $970 | $138,938 | $45,600 | $93,338 |
| 2014 | $981 | $143,196 | $45,600 | $97,596 |
Source: Public Records
Map
Nearby Homes
- 0 Fish Pond Rd
- 125 Stonehaven Ct
- 115 East Ave
- 930 Gondola Ct Unit 72A
- 1450 Saint Lukes Church Rd
- 0 Stokes Ferry Rd Unit CAR4345686
- 260 Joy Cir
- 1082 Kingsway Dr
- 245 Castle Keep Rd
- 3980 Fish Pond Rd
- 1070 Dunns Mountain Rd
- 0000 Dunns Mountain Rd
- 2050 Lake Rd
- 706 S Salisbury Ave
- 1215 Juniper St
- 621 Maple St
- 205 Willow Dr
- 0 Balfour Quarry Rd Unit 10145306
- 505 S Main St
- 0 Chapparal Dr
- 5885 Fish Pond Rd
- 5645 Fish Pond Rd
- 5925 Fish Pond Rd
- 5560 Fish Pond Rd
- 5655 Fish Pond Rd
- 250 Blueberry Farm Ln
- 5480 Fish Pond Rd
- 5475 Fish Pond Rd
- 6155 Fish Pond Rd
- 350 Fleetwood Dr
- 5190 Fish Pond Rd
- 5225 Fish Pond Rd
- 5150 Fish Pond Rd
- 5126 Fish Pond Rd
- 5185 Fish Pond Rd
- 2650 Oddie Rd
- 955 Brown Acres Rd
- 980 A&B & 950 A&B Brown Acres Rd
- 280 Fleetwood Dr
- 175 Landmark Dr
Your Personal Tour Guide
Ask me questions while you tour the home.