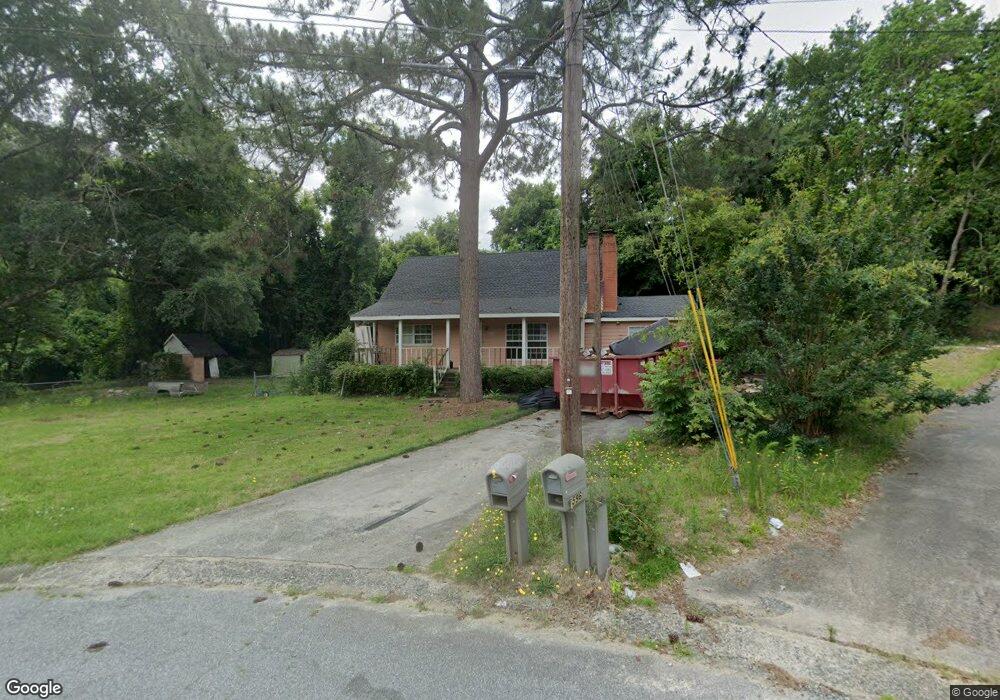
5582 Cascade Ave Macon, GA 31206
Estimated Value: $113,000 - $157,000
3
Beds
2
Baths
1,604
Sq Ft
$83/Sq Ft
Est. Value
About This Home
This home is located at 5582 Cascade Ave, Macon, GA 31206 and is currently estimated at $133,096, approximately $82 per square foot. 5582 Cascade Ave is a home located in Bibb County with nearby schools including Veterans Elementary School, Southwest High School, and Gilead Christian Academy.
Ownership History
Date
Name
Owned For
Owner Type
Purchase Details
Closed on
Sep 26, 2008
Sold by
Mcghie Wayne M
Bought by
Thompson Ramonda T
Current Estimated Value
Home Financials for this Owner
Home Financials are based on the most recent Mortgage that was taken out on this home.
Original Mortgage
$92,282
Interest Rate
6.49%
Mortgage Type
FHA
Purchase Details
Closed on
May 2, 2008
Sold by
Wells Fargo Bank Na
Bought by
Mcghie Wayne M
Purchase Details
Closed on
Oct 2, 2007
Bought by
Wells Fargo Bank
Create a Home Valuation Report for This Property
The Home Valuation Report is an in-depth analysis detailing your home's value as well as a comparison with similar homes in the area
Purchase History
| Date | Buyer | Sale Price | Title Company |
|---|---|---|---|
| Thompson Ramonda T | $93,500 | None Available | |
| Mcghie Wayne M | $50,000 | None Available | |
| Wells Fargo Bank | $83,200 | -- | |
| Wells Fargo Bank Na | $83,197 | None Available |
Source: Public Records
Mortgage History
| Date | Status | Borrower | Loan Amount |
|---|---|---|---|
| Previous Owner | Thompson Ramonda T | $92,282 |
Source: Public Records
Tax History
| Year | Tax Paid | Tax Assessment Tax Assessment Total Assessment is a certain percentage of the fair market value that is determined by local assessors to be the total taxable value of land and additions on the property. | Land | Improvement |
|---|---|---|---|---|
| 2025 | $1,089 | $44,309 | $3,400 | $40,909 |
| 2024 | $1,125 | $44,309 | $3,400 | $40,909 |
| 2023 | $1,125 | $44,309 | $3,400 | $40,909 |
| 2022 | $1,520 | $43,917 | $12,246 | $31,671 |
| 2021 | $1,669 | $43,917 | $12,246 | $31,671 |
| 2020 | $1,705 | $43,917 | $12,246 | $31,671 |
| 2019 | $532 | $43,917 | $12,246 | $31,671 |
| 2018 | $2,794 | $43,609 | $12,246 | $31,363 |
| 2017 | $1,634 | $43,609 | $12,246 | $31,363 |
| 2016 | $1,509 | $43,609 | $12,246 | $31,363 |
| 2015 | $2,136 | $43,609 | $12,246 | $31,363 |
| 2014 | $2,456 | $43,609 | $12,246 | $31,363 |
Source: Public Records
Map
Nearby Homes
- 2443 Lambert Dr
- 2521 Rocky Creek Rd
- 4249 Elkan Ave
- 2431 Vivian Dr
- 2422 Adger Rd
- 2468 Brevard Dr
- 2465 Thrasher Ave
- 4217 Fairfax Dr
- 2452 Thrasher Ave
- 4340 Thrasher Cir
- 4370 Ashland Dr
- 4416 Elkan Ave
- 2311 Lancelot Place
- 2431 Rosen Ave
- 4496 Thrasher Cir
- 2545 Greenwood Terrace
- 5756 Satterfield Dr
- 4357 Essex Rd
- 5285 Greenwood Terrace
- 2561 Greenleaf Dr
- 5562 Cascade Ave
- 5596 Cascade Ave
- 5597 Cascade Ave
- 5573 Cascade Ave
- 5554 Cascade Ave
- 5531 Cascade Ave
- 2436 Lambert Dr
- 2428 Lambert Dr
- 5540 Cascade Ave
- 2418 Lambert Dr
- 2448 Lambert Dr
- 5540 Bethesda Ave
- 2408 Lambert Dr
- 5532 Cascade Ave
- 5520 Cascade Ave
- 5532 Bethesda Ave
- 3769 Elkan Ave
- 5512 Cascade Ave
- 2476 Rocky Creek Rd
- 2470 Rocky Creek Rd
Your Personal Tour Guide
Ask me questions while you tour the home.