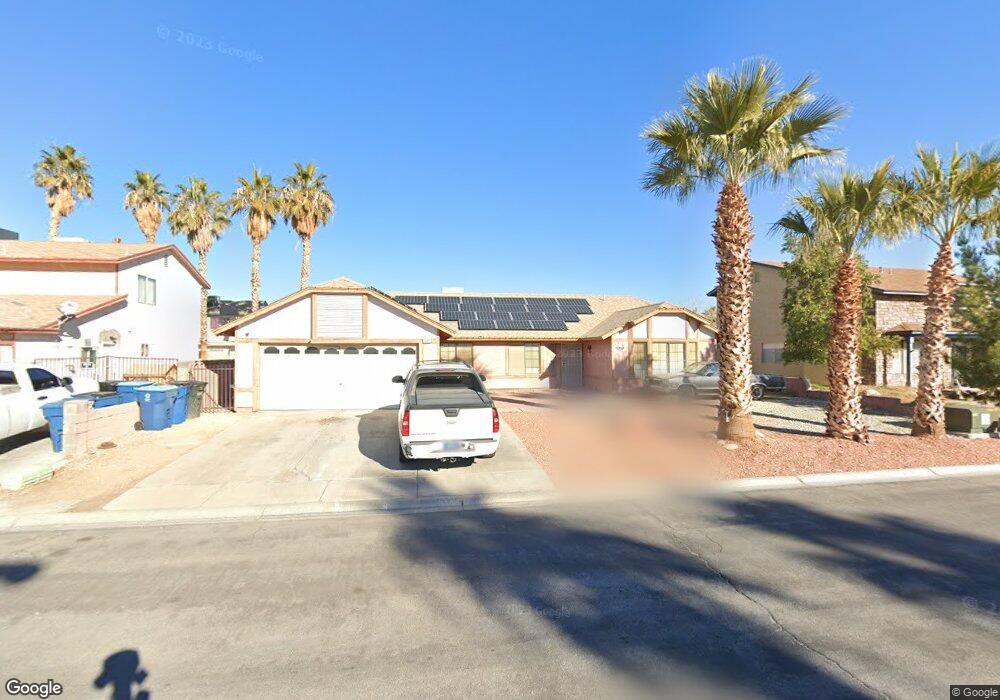
5582 Rabbit Springs Rd Las Vegas, NV 89110
Estimated Value: $433,000 - $468,000
4
Beds
2
Baths
1,795
Sq Ft
$250/Sq Ft
Est. Value
About This Home
This home is located at 5582 Rabbit Springs Rd, Las Vegas, NV 89110 and is currently estimated at $448,146, approximately $249 per square foot. 5582 Rabbit Springs Rd is a home located in Clark County with nearby schools including Stanford Elementary School, Duane D. Keller Middle School, and Eldorado High School.
Ownership History
Date
Name
Owned For
Owner Type
Purchase Details
Closed on
Feb 22, 2022
Sold by
Macias Jose A and Macias Maria H
Bought by
Macias Edith Lucero
Current Estimated Value
Purchase Details
Closed on
May 24, 2006
Sold by
Macias Maria H
Bought by
Macias Jose A
Home Financials for this Owner
Home Financials are based on the most recent Mortgage that was taken out on this home.
Original Mortgage
$179,000
Interest Rate
6.52%
Mortgage Type
Fannie Mae Freddie Mac
Purchase Details
Closed on
Mar 4, 2004
Sold by
King Marvin and King Sonya H
Bought by
Macias Jose A and Macias Maria H
Home Financials for this Owner
Home Financials are based on the most recent Mortgage that was taken out on this home.
Original Mortgage
$174,000
Interest Rate
6.38%
Mortgage Type
Unknown
Create a Home Valuation Report for This Property
The Home Valuation Report is an in-depth analysis detailing your home's value as well as a comparison with similar homes in the area
Home Values in the Area
Average Home Value in this Area
Purchase History
| Date | Buyer | Sale Price | Title Company |
|---|---|---|---|
| Macias Edith Lucero | -- | None Listed On Document | |
| Macias Jose A | -- | Lawyers Title Of Nevada | |
| Macias Jose A | -- | Accommodation | |
| Macias Jose A | $199,000 | United Title Of Nevada |
Source: Public Records
Mortgage History
| Date | Status | Borrower | Loan Amount |
|---|---|---|---|
| Previous Owner | Macias Jose A | $179,000 | |
| Previous Owner | Macias Jose A | $174,000 |
Source: Public Records
Tax History Compared to Growth
Tax History
| Year | Tax Paid | Tax Assessment Tax Assessment Total Assessment is a certain percentage of the fair market value that is determined by local assessors to be the total taxable value of land and additions on the property. | Land | Improvement |
|---|---|---|---|---|
| 2025 | $1,604 | $80,695 | $29,050 | $51,645 |
| 2024 | $1,558 | $80,695 | $29,050 | $51,645 |
| 2023 | $1,558 | $81,556 | $31,850 | $49,706 |
| 2022 | $1,586 | $70,785 | $24,850 | $45,935 |
| 2021 | $1,469 | $67,114 | $23,100 | $44,014 |
| 2020 | $1,361 | $65,039 | $21,000 | $44,039 |
| 2019 | $1,276 | $61,888 | $18,200 | $43,688 |
| 2018 | $1,217 | $58,316 | $16,100 | $42,216 |
| 2017 | $1,694 | $57,752 | $14,700 | $43,052 |
| 2016 | $1,140 | $52,445 | $8,750 | $43,695 |
| 2015 | $1,411 | $46,545 | $7,000 | $39,545 |
| 2014 | $1,102 | $37,223 | $7,000 | $30,223 |
Source: Public Records
Map
Nearby Homes
- 5754 Cinnabar Ave
- 1345 Stokes St
- 5772 Cinnabar Ave
- 5383 E Washington Ave
- 4541 E Owens Ave
- 5843 Dew Mist Ln
- 5801 Sunny Orchard Ln
- 5802 Queenstown Way
- 1667 Rockwell Ln
- 1139 Betty Ln
- 5717 Christchurch Ave
- 1385 Ringe Ln
- 1135 Carefree Peak Ct
- 1491 Sunrise View Dr
- 1831 Castleberry Ln
- 1676 Buck Island St
- 5991 Corpus Christi Ct
- 5884 Deer Valley Dr
- 5904 Yucca House Ave
- 5923 Halehaven Dr
- 5570 Rabbit Springs Rd
- 5596 Rabbit Springs Rd
- 5583 E Monroe Ave
- 5569 E Monroe Ave
- 5597 E Monroe Ave
- 5610 Rabbit Springs Rd
- 1341 Challenge Ln
- 1350 Challenge Ln
- 5555 E Monroe Ave
- 5611 E Monroe Ave
- 1340 Jarbridge Rd
- 5624 Rabbit Springs Rd
- 5540 Rabbit Springs Rd
- 1340 Challenge Ln
- 1331 Challenge Ln
- 1349 Belcher Ln
- 5541 E Monroe Ave Unit 3A
- 5625 E Monroe Ave
- 5584 E Monroe Ave
- 5598 E Monroe Ave