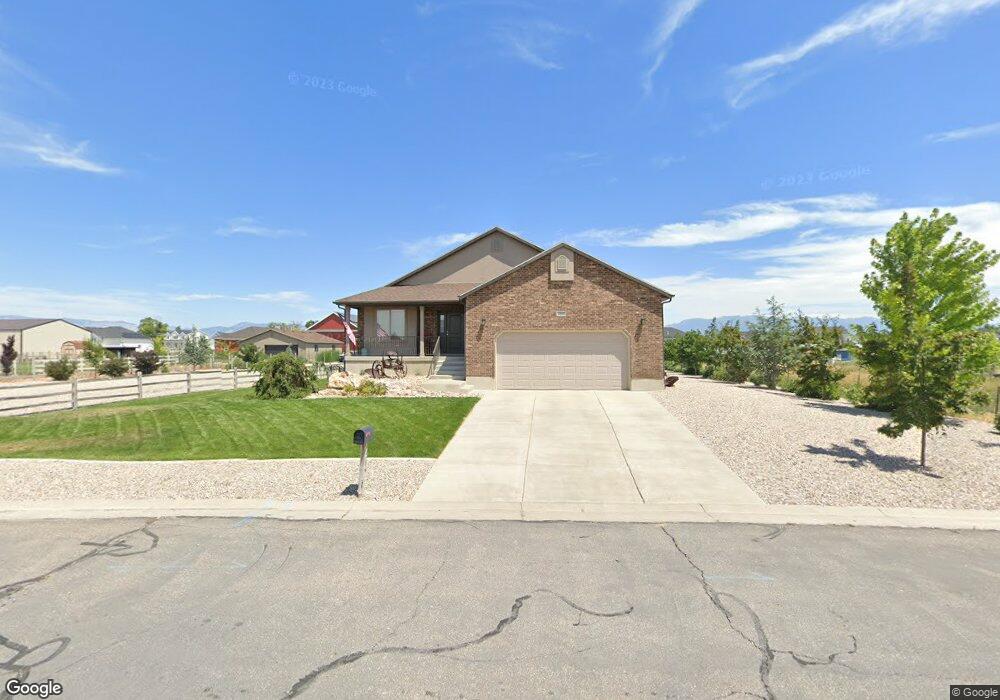
5584 S 6950 W Hooper, UT 84315
Estimated Value: $693,000 - $782,848
5
Beds
3
Baths
3,214
Sq Ft
$232/Sq Ft
Est. Value
About This Home
This home is located at 5584 S 6950 W, Hooper, UT 84315 and is currently estimated at $746,962, approximately $232 per square foot. 5584 S 6950 W is a home located in Weber County with nearby schools including Hooper Elementary School, Rocky Mountain Junior High School, and Quest Academy.
Ownership History
Date
Name
Owned For
Owner Type
Purchase Details
Closed on
Sep 30, 2014
Sold by
Fannie Mae
Bought by
Turley Christopher K and Turley Kristen S
Current Estimated Value
Home Financials for this Owner
Home Financials are based on the most recent Mortgage that was taken out on this home.
Original Mortgage
$251,750
Outstanding Balance
$192,932
Interest Rate
4.09%
Mortgage Type
New Conventional
Estimated Equity
$554,030
Purchase Details
Closed on
Jul 23, 2014
Sold by
Everbank
Bought by
Federal National Mortgage Association
Purchase Details
Closed on
May 6, 2014
Sold by
Barnes M Christine
Bought by
Everbank
Purchase Details
Closed on
Dec 7, 2006
Sold by
Mount Ogden Real Estate Inc
Bought by
Barnes M Christine
Home Financials for this Owner
Home Financials are based on the most recent Mortgage that was taken out on this home.
Original Mortgage
$53,950
Interest Rate
6.07%
Mortgage Type
Stand Alone Second
Create a Home Valuation Report for This Property
The Home Valuation Report is an in-depth analysis detailing your home's value as well as a comparison with similar homes in the area
Home Values in the Area
Average Home Value in this Area
Purchase History
| Date | Buyer | Sale Price | Title Company |
|---|---|---|---|
| Turley Christopher K | $265,000 | United Title Services | |
| Federal National Mortgage Association | -- | Lsi Title Insurance Agency | |
| Everbank | $288,688 | Security Title Ins Agency | |
| Barnes M Christine | -- | U S Title Of Utah Ogden |
Source: Public Records
Mortgage History
| Date | Status | Borrower | Loan Amount |
|---|---|---|---|
| Open | Turley Christopher K | $251,750 | |
| Previous Owner | Barnes M Christine | $53,950 | |
| Previous Owner | Barnes M Christine | $215,900 |
Source: Public Records
Tax History
| Year | Tax Paid | Tax Assessment Tax Assessment Total Assessment is a certain percentage of the fair market value that is determined by local assessors to be the total taxable value of land and additions on the property. | Land | Improvement |
|---|---|---|---|---|
| 2025 | $3,824 | $703,303 | $177,867 | $525,436 |
| 2024 | $3,666 | $378,398 | $97,826 | $280,572 |
| 2023 | $3,658 | $372,901 | $96,967 | $275,934 |
| 2022 | $3,709 | $385,550 | $86,428 | $299,122 |
| 2021 | $2,868 | $501,631 | $137,057 | $364,574 |
| 2020 | $2,611 | $419,000 | $121,962 | $297,038 |
| 2019 | $2,706 | $411,000 | $123,346 | $287,654 |
| 2018 | $2,809 | $408,389 | $123,323 | $285,066 |
| 2017 | $2,435 | $344,000 | $88,779 | $255,221 |
| 2016 | $2,154 | $164,668 | $48,859 | $115,809 |
| 2015 | $1,853 | $139,962 | $29,668 | $110,294 |
| 2014 | $1,719 | $126,417 | $29,668 | $96,749 |
Source: Public Records
Map
Nearby Homes
- 5585 S 6950 W
- 5801 S 7100 W
- 6868 W 5100 S
- 5015 S 6700 W
- 6242 W 5950 S
- 6014 W 5300 S
- 0 W 5500 S
- 6036 W 4700 S
- 5957 W 4700 S
- 4100 S 5900 W
- 3729 S 5600 W Unit 6
- 3720 S 5600 W Unit 2
- 3732 S 5600 W Unit 3
- 3719 S 5600 W Unit 7
- 5335 W 5500 S
- 4129 S 5800 W Unit 4
- 4146 S 5800 W Unit 5
- 4194 S 5800 W Unit 14
- 4168 S 5800 W Unit 12
- 4179 S 5800 W Unit 1
Your Personal Tour Guide
Ask me questions while you tour the home.