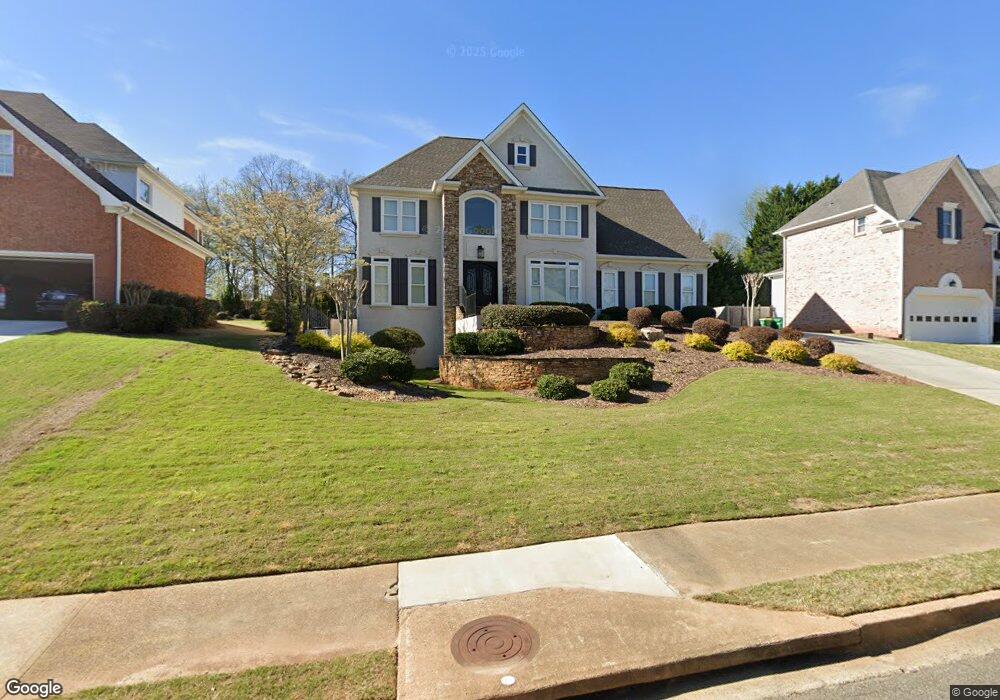
5585 Preserve Cir Alpharetta, GA 30005
Seven Oaks NeighborhoodEstimated Value: $797,000 - $915,000
4
Beds
4
Baths
3,061
Sq Ft
$273/Sq Ft
Est. Value
About This Home
This home is located at 5585 Preserve Cir, Alpharetta, GA 30005 and is currently estimated at $834,209, approximately $272 per square foot. 5585 Preserve Cir is a home located in Fulton County with nearby schools including River Trail Middle School, Northview High School, and McGinnis Woods School.
Ownership History
Date
Name
Owned For
Owner Type
Purchase Details
Closed on
Aug 30, 2023
Sold by
Gilbreath Charles Stanton
Bought by
Gilbreath Charles Stanton and Gilbreath Courtney Lenharr
Current Estimated Value
Purchase Details
Closed on
Oct 5, 2016
Sold by
Gilbreath Tamera Jean
Bought by
Gilbreath Charles Stanton
Purchase Details
Closed on
Jun 16, 2014
Sold by
Kaine Tamera J
Bought by
Gilbreath Tamera J and Gilbreath Charles S
Purchase Details
Closed on
Dec 20, 1999
Sold by
Kaine Michael S
Bought by
Kaine Tamera J
Purchase Details
Closed on
Dec 29, 1993
Sold by
Englishbuilt Homes Inc
Bought by
Kaine Michael S Tamera J
Home Financials for this Owner
Home Financials are based on the most recent Mortgage that was taken out on this home.
Original Mortgage
$183,500
Interest Rate
5.5%
Create a Home Valuation Report for This Property
The Home Valuation Report is an in-depth analysis detailing your home's value as well as a comparison with similar homes in the area
Home Values in the Area
Average Home Value in this Area
Purchase History
| Date | Buyer | Sale Price | Title Company |
|---|---|---|---|
| Gilbreath Charles Stanton | -- | -- | |
| Gilbreath Charles Stanton | -- | -- | |
| Gilbreath Tamera J | -- | -- | |
| Kaine Tamera J | -- | -- | |
| Kaine Michael S Tamera J | $34,500 | -- |
Source: Public Records
Mortgage History
| Date | Status | Borrower | Loan Amount |
|---|---|---|---|
| Previous Owner | Kaine Michael S Tamera J | $183,500 |
Source: Public Records
Tax History Compared to Growth
Tax History
| Year | Tax Paid | Tax Assessment Tax Assessment Total Assessment is a certain percentage of the fair market value that is determined by local assessors to be the total taxable value of land and additions on the property. | Land | Improvement |
|---|---|---|---|---|
| 2025 | $8,713 | $311,840 | $73,000 | $238,840 |
| 2023 | $8,193 | $290,280 | $56,160 | $234,120 |
| 2022 | $6,193 | $219,400 | $41,960 | $177,440 |
| 2021 | $3,949 | $177,120 | $38,640 | $138,480 |
| 2020 | $3,982 | $169,720 | $27,560 | $142,160 |
| 2019 | $459 | $187,320 | $52,960 | $134,360 |
| 2018 | $4,991 | $153,240 | $51,680 | $101,560 |
| 2017 | $4,033 | $118,480 | $27,560 | $90,920 |
| 2016 | $4,051 | $120,760 | $27,560 | $93,200 |
| 2015 | $3,755 | $110,720 | $27,560 | $83,160 |
| 2014 | $3,445 | $110,720 | $27,560 | $83,160 |
Source: Public Records
Map
Nearby Homes
- 680 Evening Pine Ln
- 5650 Preserve Cir
- 640 Evening Pine Ln
- 5735 Sunset Maple Dr
- 140 Ashewoode Downs Ln
- 5635 Ashewoode Downs Dr
- 5440 Vicarage Walk
- 5510 Vicarage Walk
- 12470 Concord Hall Dr
- 5455 Woodrun Ln
- 7530 Newstead Dr
- 7105 Brookwood Way
- 110 W Meadows Ct
- 3180 Caney Creek Ln
- 12205 Stevens Creek Dr
- 7170 Collingsworth Place
- 0 Preserve Cir Unit 7347065
- 0 Preserve Cir Unit 8941942
- 0 Preserve Cir Unit 7425906
- 0 Preserve Cir Unit 8277407
- 0 Preserve Cir Unit 8176970
- 0 Preserve Cir Unit 8106195
- 0 Preserve Cir Unit 8098582
- 0 Preserve Cir Unit 7549752
- 0 Preserve Cir Unit 8094357
- 0 Preserve Cir Unit 7121742
- 5575 Preserve Cir
- 5595 Preserve Cir
- 5565 Preserve Cir
- 5600 Preserve Cir
- 5610 Preserve Cir
- 685 Evening Pine Ln Unit 2
- 12550 Preserve Ln
- 5615 Preserve Cir
- 5555 Preserve Cir
- 5620 Preserve Cir